Fig. 1.
Download original image
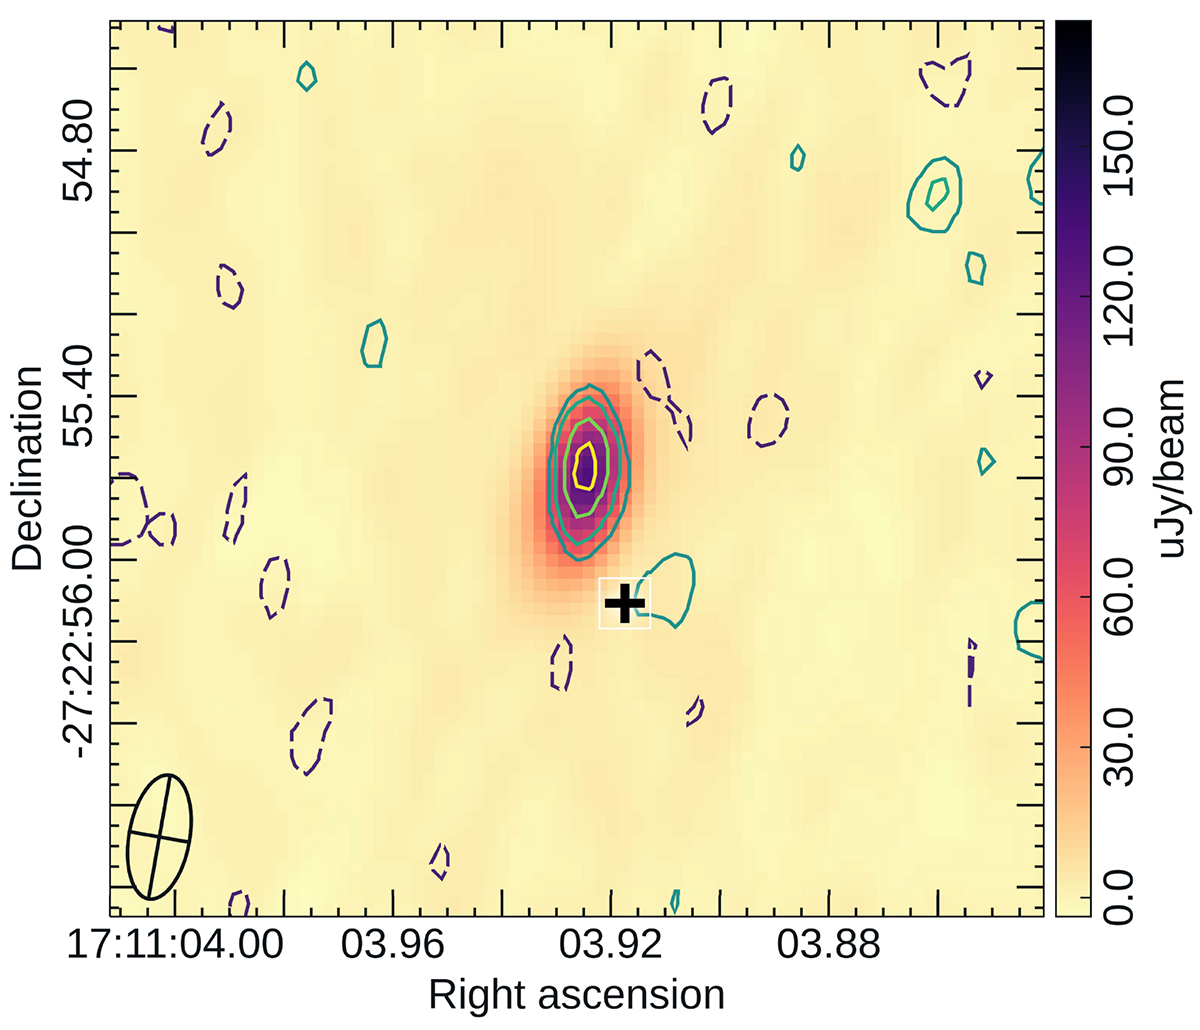
Continuum map, centered at the position of the YSO, combining the eight observations of this work. The color scale indicates the Stokes I emission. Contours identify the Stokes V emission, at a level of −3, −2, 2, 3, 5, and 7 times the Stokes V rms, which is σV ∼ 1.1 μJy beam−1. Negative contours are shown in purple dashes, and positive ones in green-yellow solid lines. The cross (+) marks the position of the tentative brown draft seen in previous VLA observations. The synthesized beam is shown in the lower-left corner.
Current usage metrics show cumulative count of Article Views (full-text article views including HTML views, PDF and ePub downloads, according to the available data) and Abstracts Views on Vision4Press platform.
Data correspond to usage on the plateform after 2015. The current usage metrics is available 48-96 hours after online publication and is updated daily on week days.
Initial download of the metrics may take a while.