Open Access
Fig. A.1
Download original image
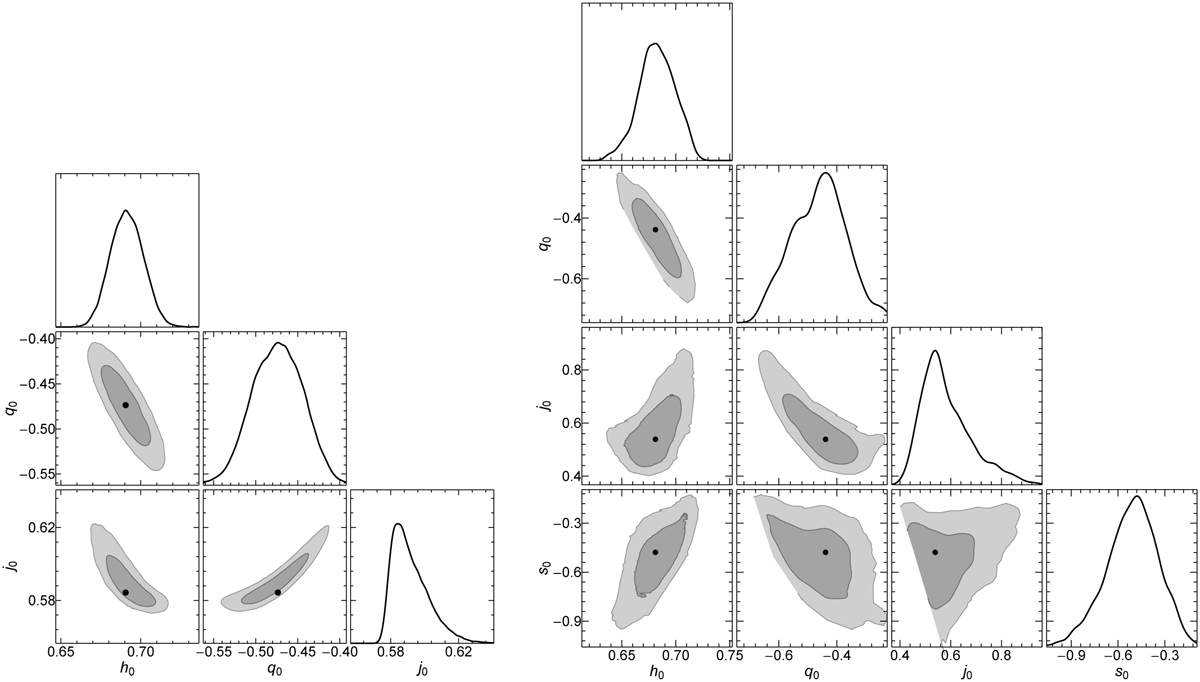
DESI-BAO+OHD contour plots of the cosmographic series up to j0 (left) and up to s0 (right). The best-fit parameters are indicated by black circles, whereas the 1σ (2σ) contours are shown as dark (light) grey areas.
Current usage metrics show cumulative count of Article Views (full-text article views including HTML views, PDF and ePub downloads, according to the available data) and Abstracts Views on Vision4Press platform.
Data correspond to usage on the plateform after 2015. The current usage metrics is available 48-96 hours after online publication and is updated daily on week days.
Initial download of the metrics may take a while.