Fig. B.1
Download original image
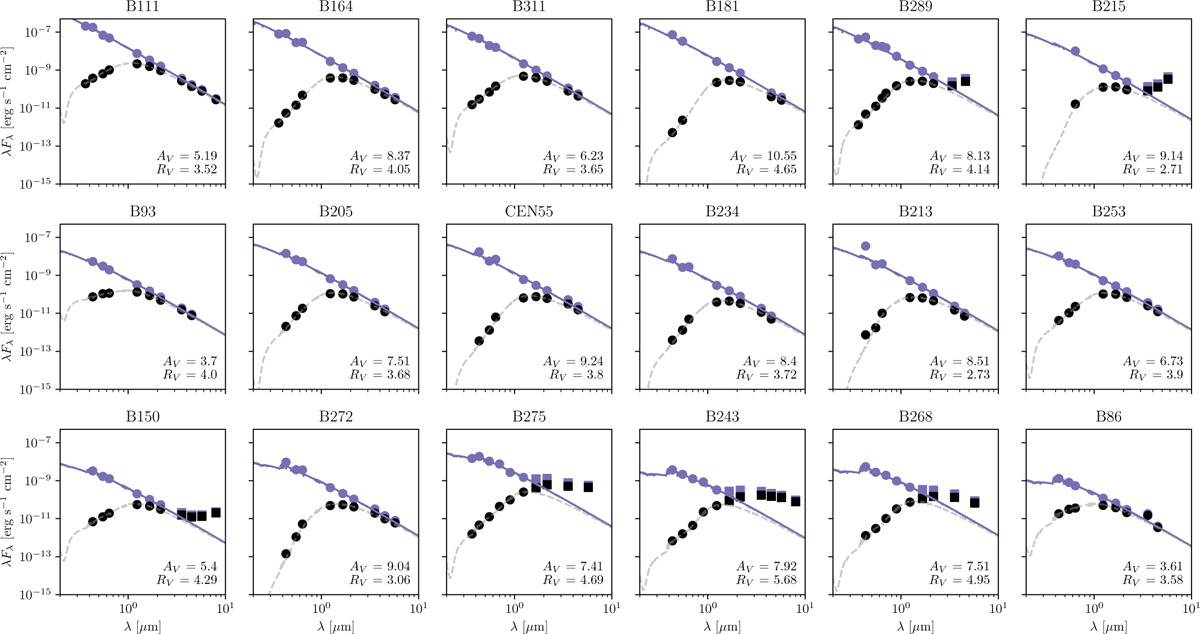
Observed and dereddened SED of each star. Black squares and dots indicate observed photometric data, purple markers indicate dereddened data. The squares indicate data with IR excess emission; these are not used for the determination of the extinction. The dashed gray line shows the reddened stellar model and the purple solid line the original stellar model.
Current usage metrics show cumulative count of Article Views (full-text article views including HTML views, PDF and ePub downloads, according to the available data) and Abstracts Views on Vision4Press platform.
Data correspond to usage on the plateform after 2015. The current usage metrics is available 48-96 hours after online publication and is updated daily on week days.
Initial download of the metrics may take a while.