Fig. 7
Download original image
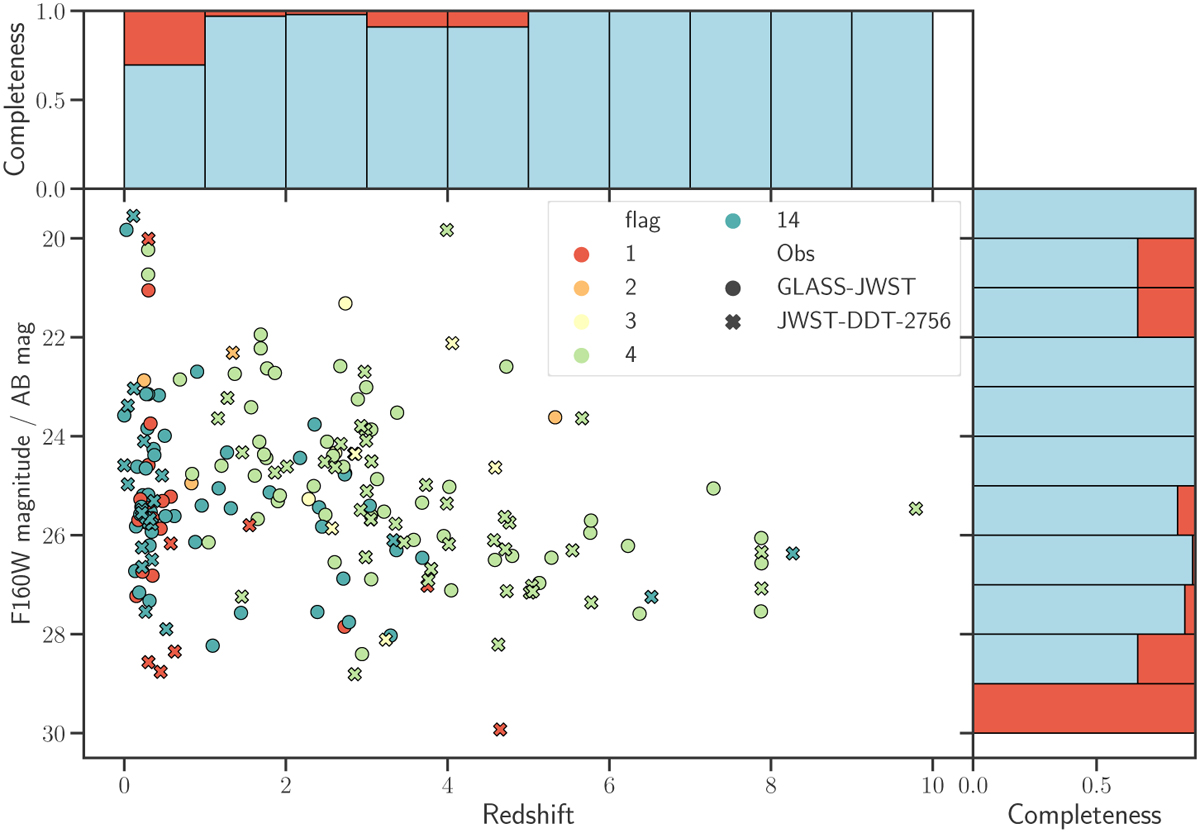
Redshift distribution as a function of the F160W magnitude, with symbols indicating observations from the GLASS-JWST program (circles) and the JWST-DDT-2756 program (x marks). The color of each data point corresponds to its respective flag value (follow-up of Fig. 6 in Treu et al. 2022). In the upper panel, we display the completeness in redshift, with red indicating the percentage of sources with no redshift estimation, while in light blue, we represent the total fraction normalized to 1 of the sources in the bin. Similarly, in the right panel, we show the completeness in the F160W magnitude, following the same color scheme.
Current usage metrics show cumulative count of Article Views (full-text article views including HTML views, PDF and ePub downloads, according to the available data) and Abstracts Views on Vision4Press platform.
Data correspond to usage on the plateform after 2015. The current usage metrics is available 48-96 hours after online publication and is updated daily on week days.
Initial download of the metrics may take a while.