Fig. A.1
Download original image
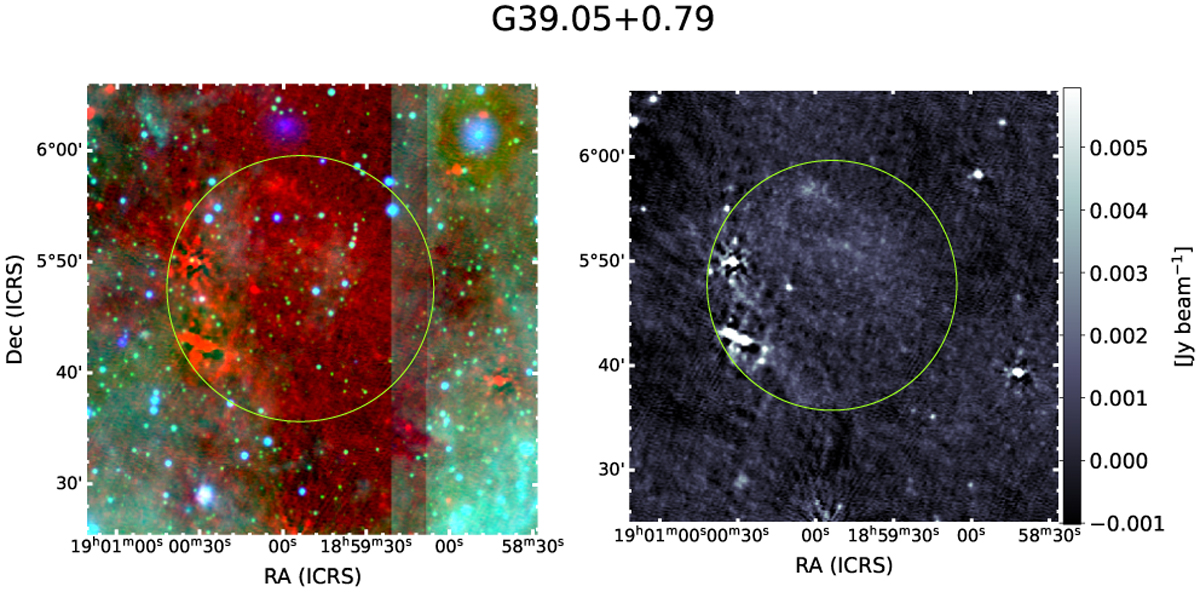
G39.05+0.79 in radio and in false colour map with MIR images from WISE W3 and W4 bands. Right panel shows the candidate at 144MHz in the low resolution image of the LoTSS survey. Left panel shows a false colour map of the region with LoTSS in red (2m), WISE W3 band in green (12 μm) and WISE W4 band in blue (22 μm). North is upwards and West is leftwards. The green solid line indicates the candidate.
Current usage metrics show cumulative count of Article Views (full-text article views including HTML views, PDF and ePub downloads, according to the available data) and Abstracts Views on Vision4Press platform.
Data correspond to usage on the plateform after 2015. The current usage metrics is available 48-96 hours after online publication and is updated daily on week days.
Initial download of the metrics may take a while.