Fig. 4
Download original image
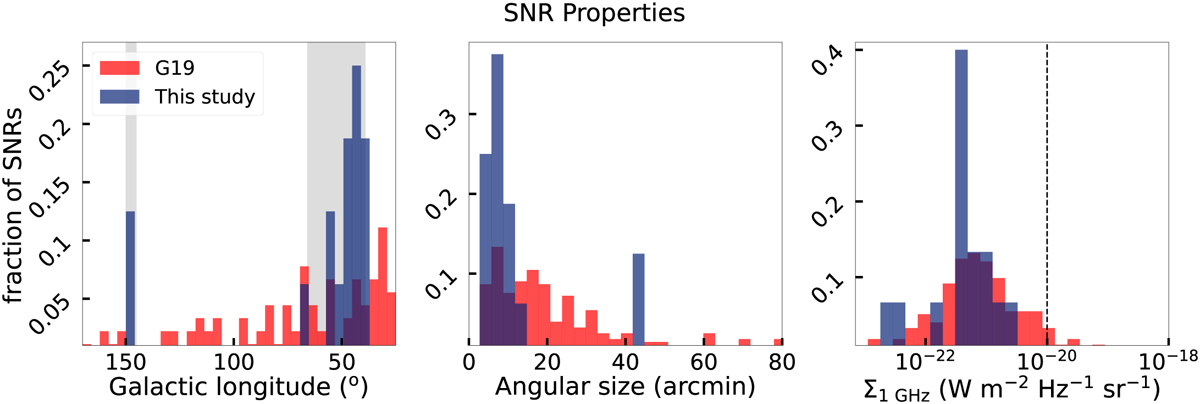
Properties of the candidate SNRs reported in this work, compared to the Galactic census of SNRs in the G19 catalogue. Depicted in blue is the sample of the candidate SNRs reported in this work. In red are the SNRs listed in the G19 catalogue. The height of the bars indicates the fraction of SNRs or SNR candidates within each bin, according to the colour scheme of their corresponding sample. The left panel shows the histogram of Galactic longitude of known SNRs and the new SNR candidates. The grey shaded background indicates the longitude range of the two Galactic regions used in this study. The middle panel shows the histogram of the angular size (semimajor axis) of known SNRs and the new SNR candidates. The right panel shows the histogram of the surface brightness of known SNRs and the new SNR candidates, at 1 GHz. The surface brightness of the candidate SNRs at 1 GHz was estimated using a typical SNR spectral index of α = −0.5 and the measured integrated flux density at 144 MHz. The dashed black line indicates the completeness limit proposed by Green (2004) for the catalogue presented therein.
Current usage metrics show cumulative count of Article Views (full-text article views including HTML views, PDF and ePub downloads, according to the available data) and Abstracts Views on Vision4Press platform.
Data correspond to usage on the plateform after 2015. The current usage metrics is available 48-96 hours after online publication and is updated daily on week days.
Initial download of the metrics may take a while.