Fig. 3
Download original image
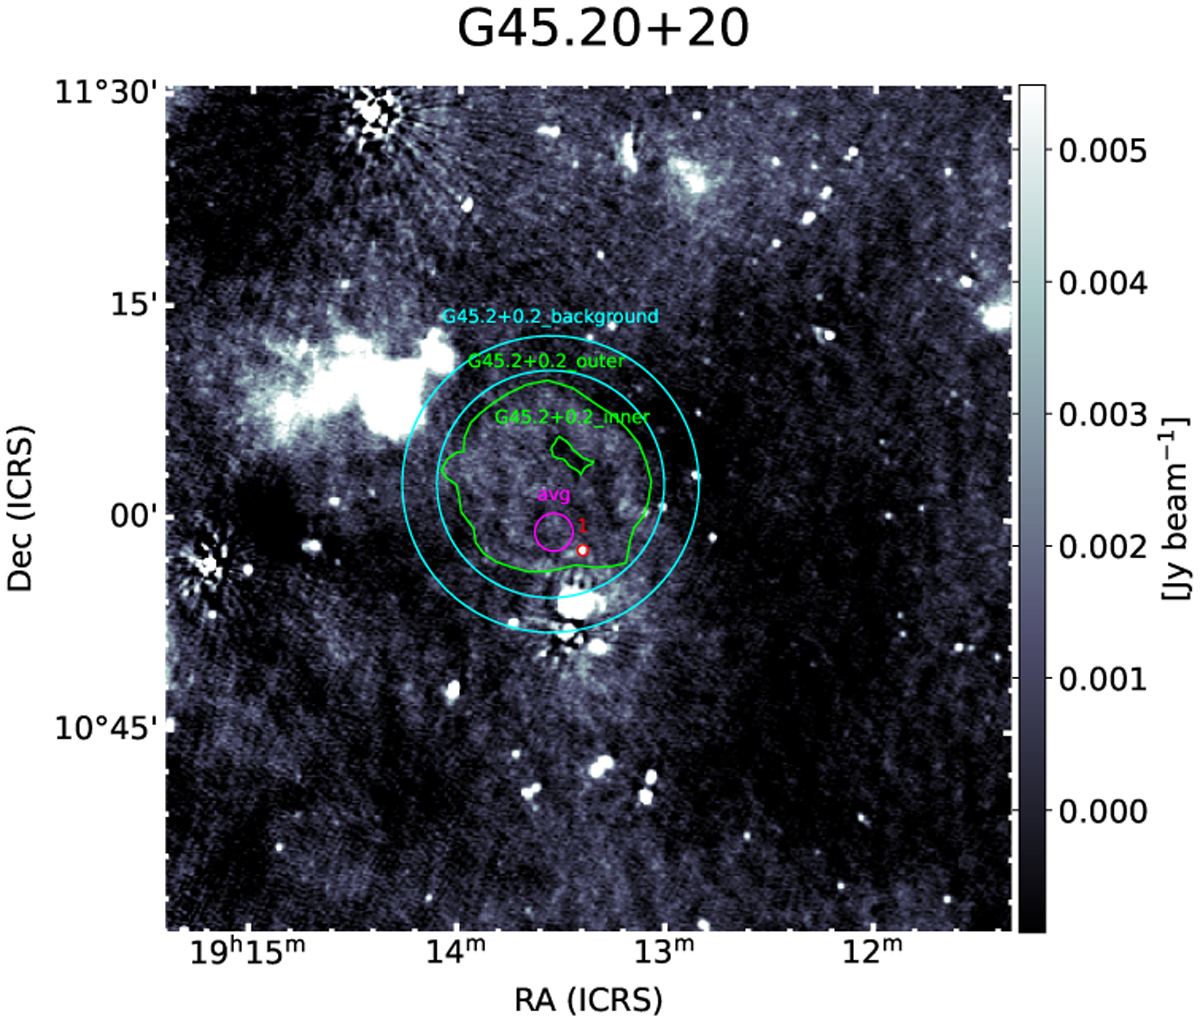
LoTSS image of the candidate SNR G45.20+0.20. Green polygons define the regions that encompass the supernova. The magenta region is the one used to calculate a representative average pixel value of the SNR. The red region encircles a contaminating external radio source. The cyan region defines a representative part of the radio background.
Current usage metrics show cumulative count of Article Views (full-text article views including HTML views, PDF and ePub downloads, according to the available data) and Abstracts Views on Vision4Press platform.
Data correspond to usage on the plateform after 2015. The current usage metrics is available 48-96 hours after online publication and is updated daily on week days.
Initial download of the metrics may take a while.