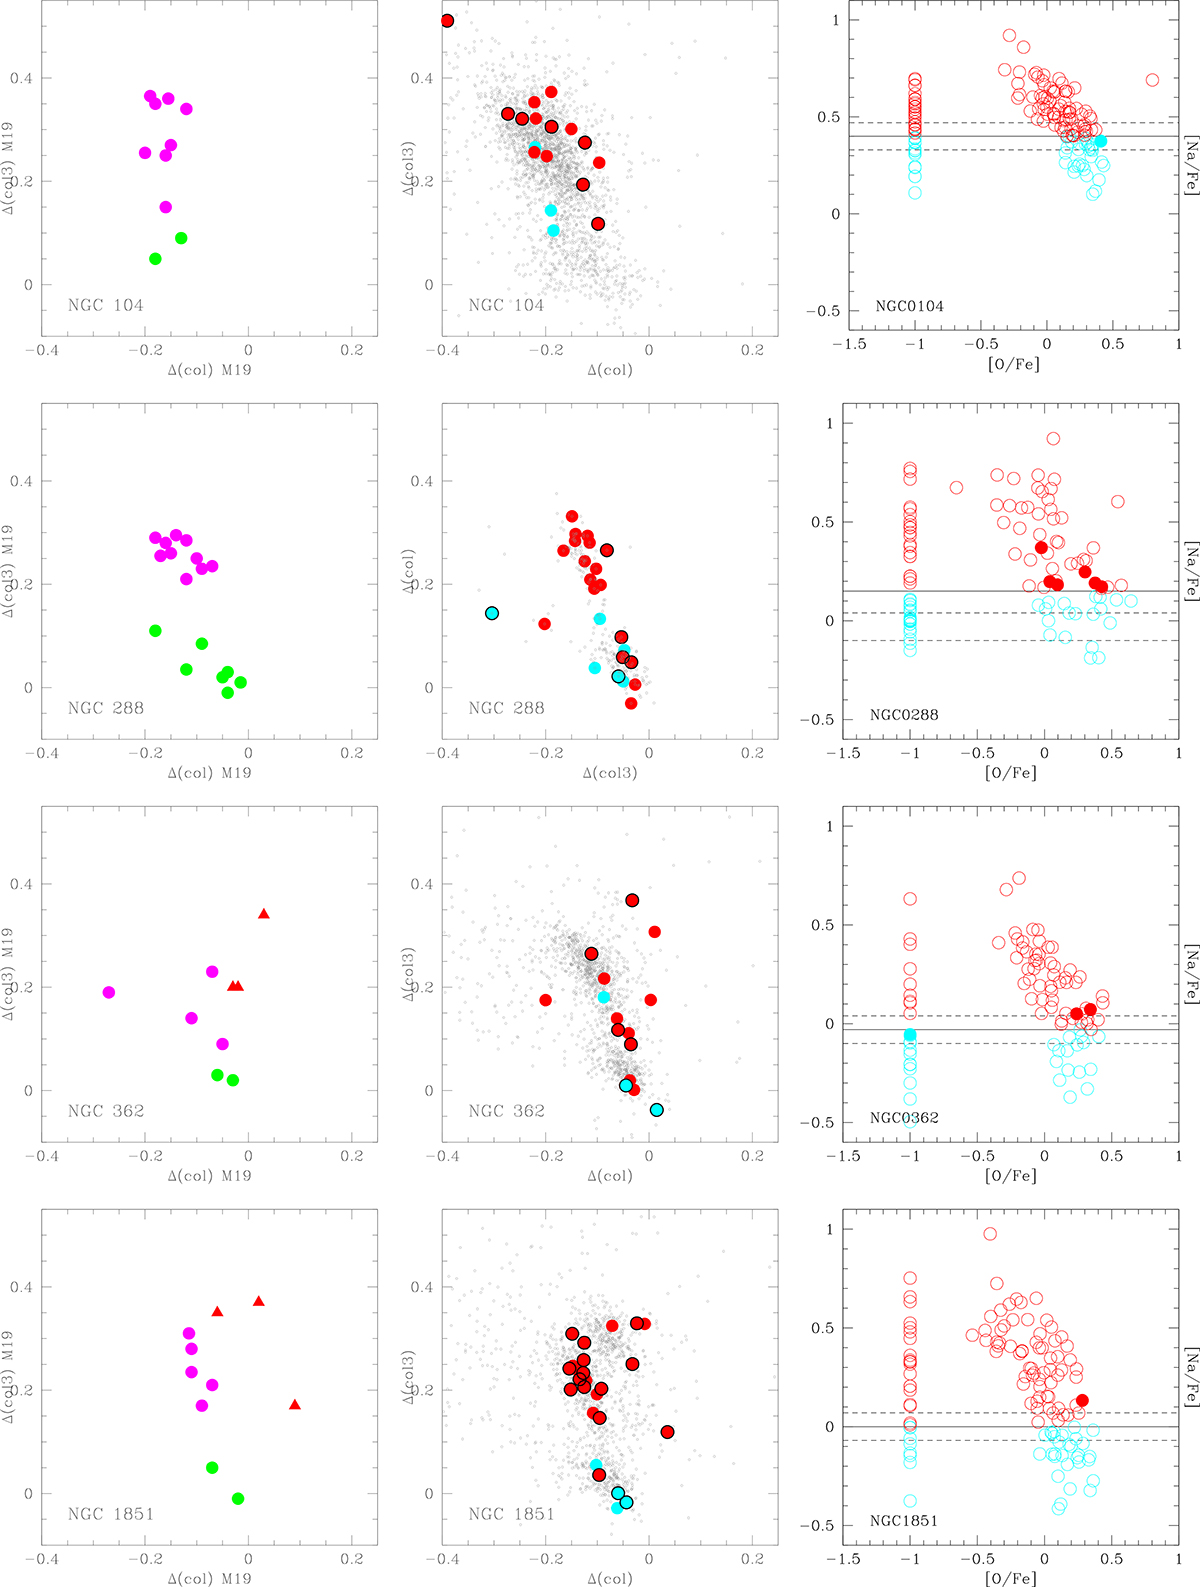
Fig. 6.
Download original image
Stars with spectroscopy on the PCMs of NGC 0104, NGC 288, NGC 362, and NGC 1851. In the left panels, the photometric classification of MPs is adopted; and in the middle panels, the population assignment is based on spectroscopy. Our PCMs are indicated with small grey dots. In the right panels, stars considered mismatches in classification are superimposed to the Na−O anti-correlation (as filled symbols). Solid lines in each GC indicate the limit [Na/Fe]min + 0.3 dex (with a range ±0.07 dex, dashed lines) used to separate FG and SG stars. The colour-coding is as in Fig. 5.
Current usage metrics show cumulative count of Article Views (full-text article views including HTML views, PDF and ePub downloads, according to the available data) and Abstracts Views on Vision4Press platform.
Data correspond to usage on the plateform after 2015. The current usage metrics is available 48-96 hours after online publication and is updated daily on week days.
Initial download of the metrics may take a while.