Open Access
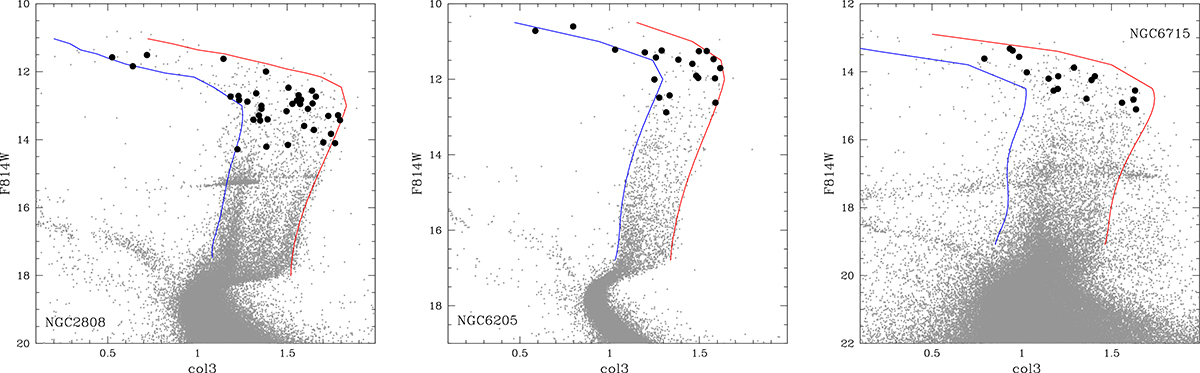
Fig. 4.
Download original image
Examples of saturation effect in col3, F814W plot for three GCs in our sample. Filled black circles are stars with spectroscopy available used by Marino et al. (2019). These stars also lie outside the vertical distribution of the RGB, so we extended the fiducial lines to bracket also these objects.
Current usage metrics show cumulative count of Article Views (full-text article views including HTML views, PDF and ePub downloads, according to the available data) and Abstracts Views on Vision4Press platform.
Data correspond to usage on the plateform after 2015. The current usage metrics is available 48-96 hours after online publication and is updated daily on week days.
Initial download of the metrics may take a while.