Fig. 6.
Download original image
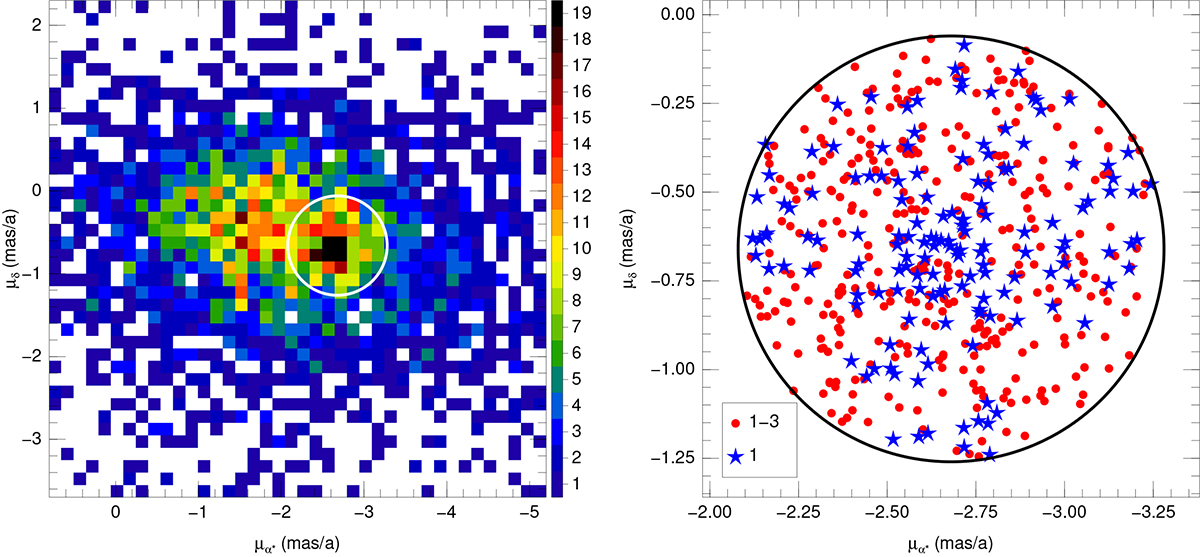
Proper motion diagrams for different samples in this paper. Left: histogram for sample 4, excluding the regions with high relative proper motions for visibility purposes. The white circle marks the selected region for samples 1–3. Right: individual proper motions for sample 1 (blue stars) and for the differential 1–3 sample (red circles).
Current usage metrics show cumulative count of Article Views (full-text article views including HTML views, PDF and ePub downloads, according to the available data) and Abstracts Views on Vision4Press platform.
Data correspond to usage on the plateform after 2015. The current usage metrics is available 48-96 hours after online publication and is updated daily on week days.
Initial download of the metrics may take a while.