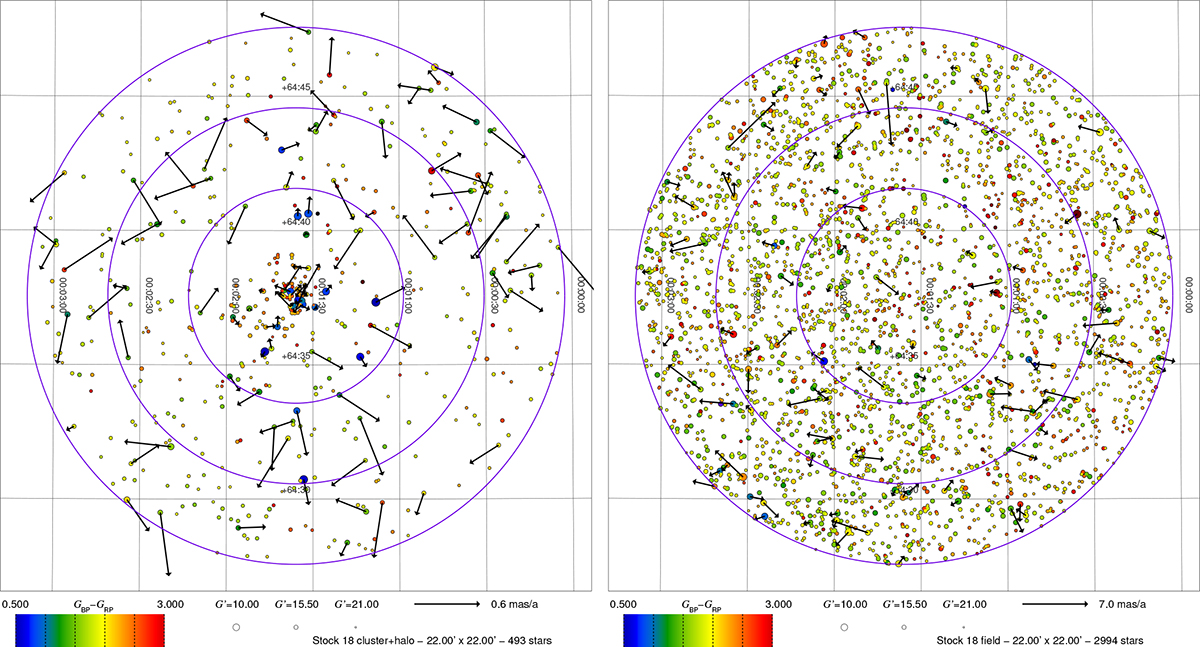
Fig. 5.
Download original image
Gaia charts for the stars in samples 1, 2, and 3 (left) and stars in differential sample 3–4 (right). The same three circles as in Fig. 1 are plotted. Symbol size represents G3′ magnitude, symbol color GBP, 3 − GRP, 3, and arrows proper motion. The magnitude and color scales are common to both panels (see legend) and stars without a valid GBP, 3 − GRP, 3 are shown without a color. The proper motions have the mean value derived for sample 1 subtracted and the two scales are different, as indicated in the legend. Only the proper motions for the 100 brightest stars in each panel are shown.
Current usage metrics show cumulative count of Article Views (full-text article views including HTML views, PDF and ePub downloads, according to the available data) and Abstracts Views on Vision4Press platform.
Data correspond to usage on the plateform after 2015. The current usage metrics is available 48-96 hours after online publication and is updated daily on week days.
Initial download of the metrics may take a while.