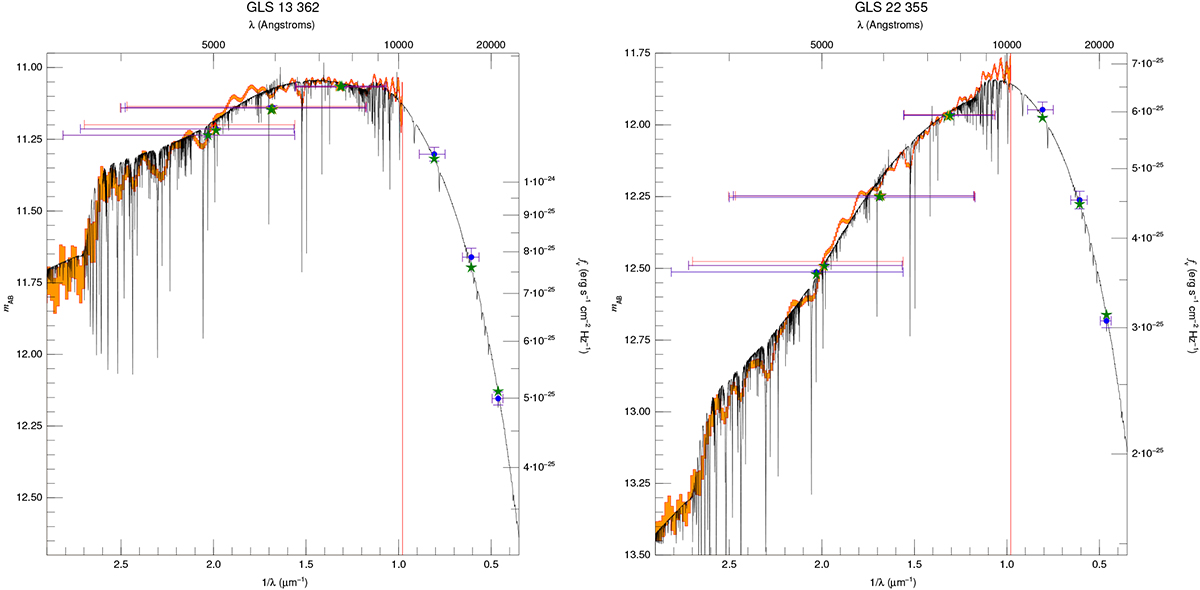
Fig. 4.
Download original image
CHORIZOS SED fits (black lines) to the observed photometry (blue error bars) for the least (left panel) and most (right panel) extinguished stars in the CHORIZOS sample. The green stars show the model SED magnitudes for each band. The orange banded region shows the Gaia DR3 XP spectrophotometry with errors but note that it is not used for the SED fits. The vertical axis spans 1.75 mag in both cases to highlight the significant differences in extinction within Stock 18. Note that both stars have the same spectral type and, hence, very similar intrinsic SEDs.
Current usage metrics show cumulative count of Article Views (full-text article views including HTML views, PDF and ePub downloads, according to the available data) and Abstracts Views on Vision4Press platform.
Data correspond to usage on the plateform after 2015. The current usage metrics is available 48-96 hours after online publication and is updated daily on week days.
Initial download of the metrics may take a while.