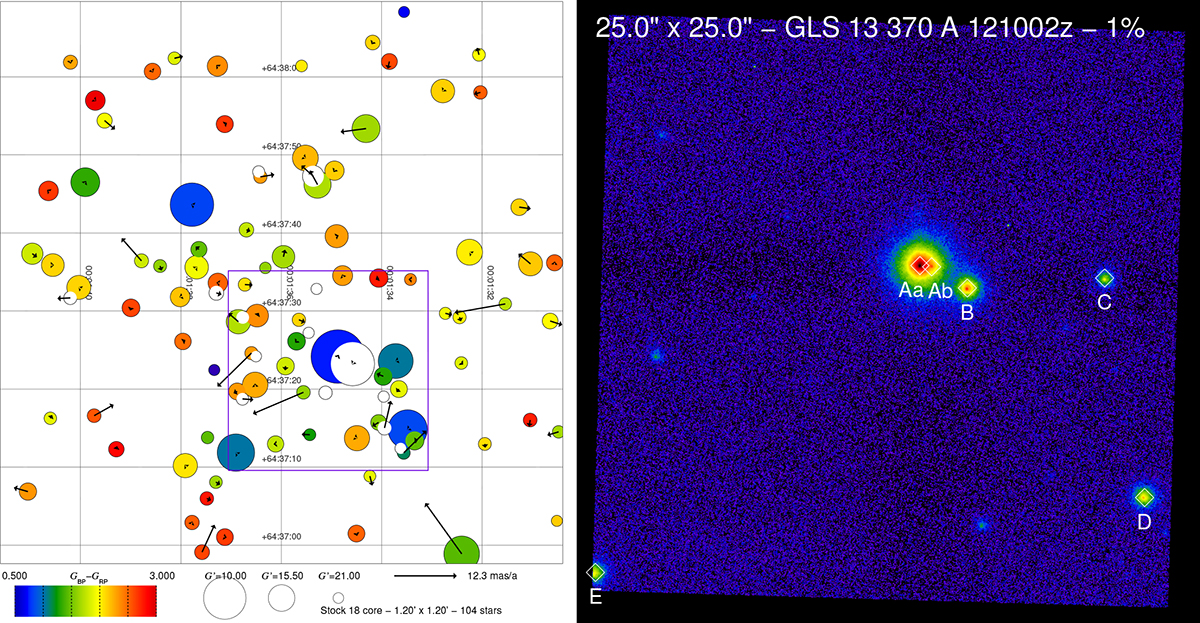
Fig. 2.
Download original image
The core of Stock 18. Left: Gaia chart for all stars (members and non-members alike) in the central 1.2′×1.2′ of Stock 18. Symbol size represents G3′ magnitude, symbol color GBP, 3 − GRP, 3, and arrows proper motion. Stars without GBP, 3 − GRP, 3 are shown without a color. The proper motions have the mean value derived for sample 1 subtracted. The purple square indicates the region shown in the right panel. Right: AstraLux z lucky image of the GLS 13 370 system, indicating the five WDS components with A divided into Aa and Ab. The intensity scale is logarithmic to show both bright and faint sources.
Current usage metrics show cumulative count of Article Views (full-text article views including HTML views, PDF and ePub downloads, according to the available data) and Abstracts Views on Vision4Press platform.
Data correspond to usage on the plateform after 2015. The current usage metrics is available 48-96 hours after online publication and is updated daily on week days.
Initial download of the metrics may take a while.