Fig. 11.
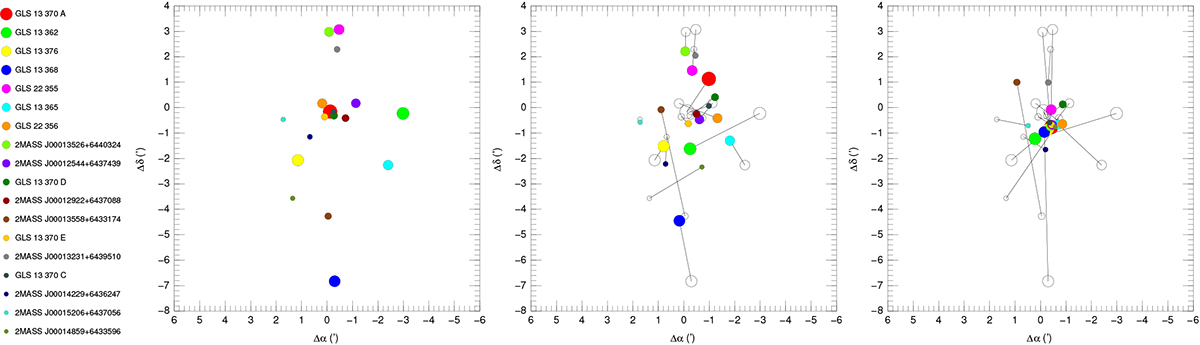
Download original image
Charts for the 18 bright stars described in the text color-coded by ID and with symbol size representing a G3′ magnitude scale. Left: Current positions. Center: Backtraced positions using the Gaia DR3 proper motions for 0.61 Ma ago, with empty circles used for the current positions and lines joining the backtraced and current positions. Right: Same as the previous panel for 0.88 Ma ago selecting the proper motions within 2.5 sigmas of the measured values that minimize the average mean separation between pairs.
Current usage metrics show cumulative count of Article Views (full-text article views including HTML views, PDF and ePub downloads, according to the available data) and Abstracts Views on Vision4Press platform.
Data correspond to usage on the plateform after 2015. The current usage metrics is available 48-96 hours after online publication and is updated daily on week days.
Initial download of the metrics may take a while.