Fig. 1.
Download original image
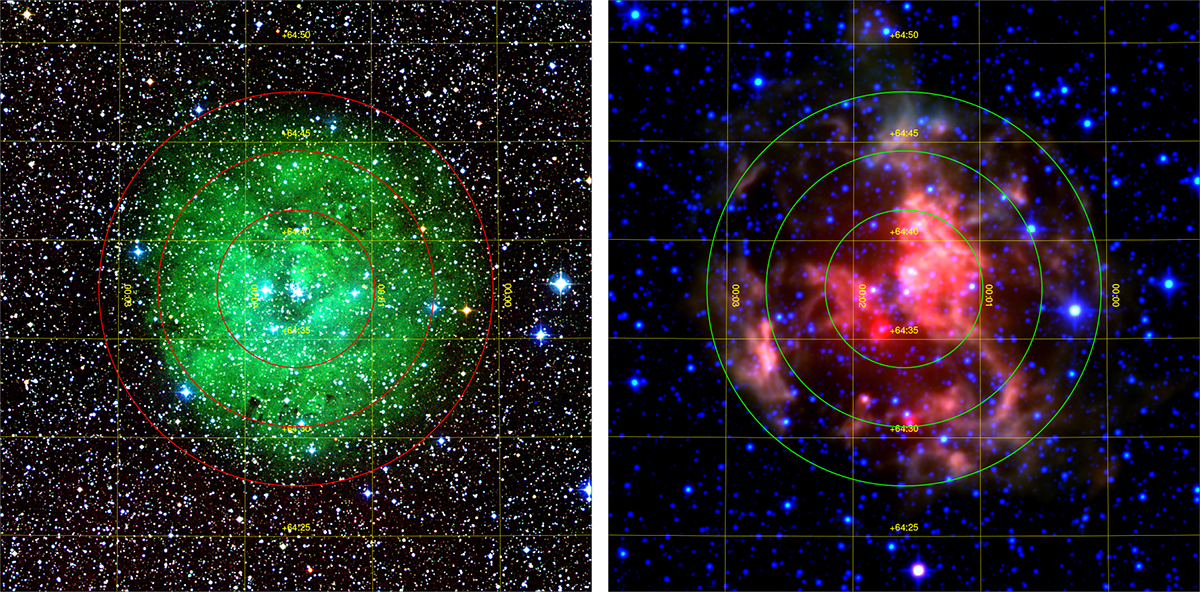
Images of Stock 18. Left: three-channel DSS2 RGB image with the red channel corresponding to the NIR survey, the green channel to the Red survey, and the blue channel to the Blue survey. Right: WISE RGB image with the red channel corresponding to the W4 band, the green channel to a sum of the W3 and W2 bands, and the blue channel to the W1 band. In both cases, the intensity scale is logarithmic and circles with radii of 4′, 7′, and 10′ centered on the cluster are plotted
Current usage metrics show cumulative count of Article Views (full-text article views including HTML views, PDF and ePub downloads, according to the available data) and Abstracts Views on Vision4Press platform.
Data correspond to usage on the plateform after 2015. The current usage metrics is available 48-96 hours after online publication and is updated daily on week days.
Initial download of the metrics may take a while.