Fig. 5.

Download original image
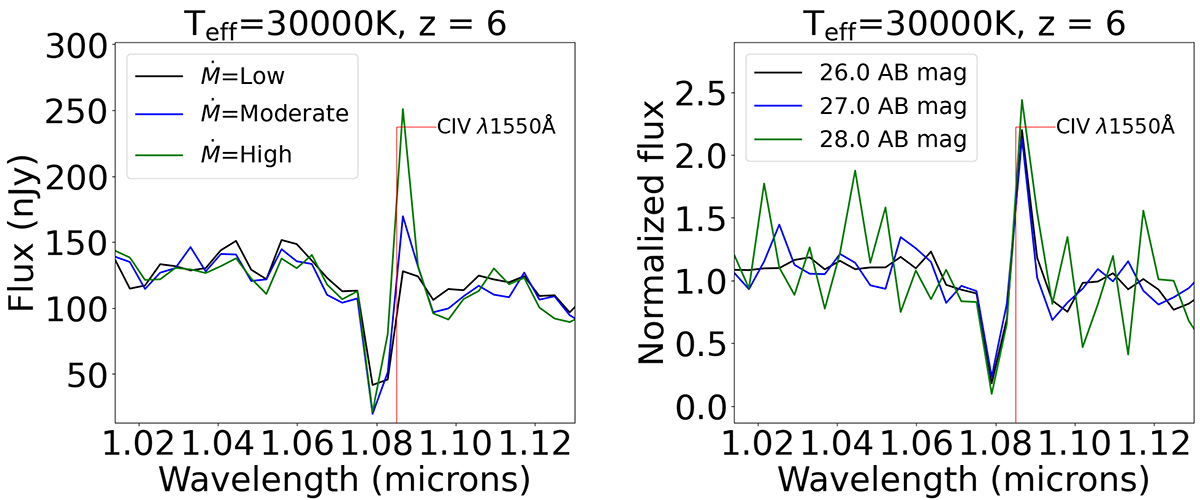
JWST/NIRSpec mock spectra illustrating how the mass-loss rate affects the detectability of a spectral line, in particular C IVλ1550 Å. The figures depict the spectra for a star with Teff = 30 000 K and a redshift of z = 6. The left figure compares different mass-loss rates and illustrates its effect on the strength of the emission part of the line, while the right figure shows how the spectral line is consistently detectable up to 28 AB mag if a high mass-loss rate is used.
Current usage metrics show cumulative count of Article Views (full-text article views including HTML views, PDF and ePub downloads, according to the available data) and Abstracts Views on Vision4Press platform.
Data correspond to usage on the plateform after 2015. The current usage metrics is available 48-96 hours after online publication and is updated daily on week days.
Initial download of the metrics may take a while.


