Open Access
Fig. 4.
Download original image
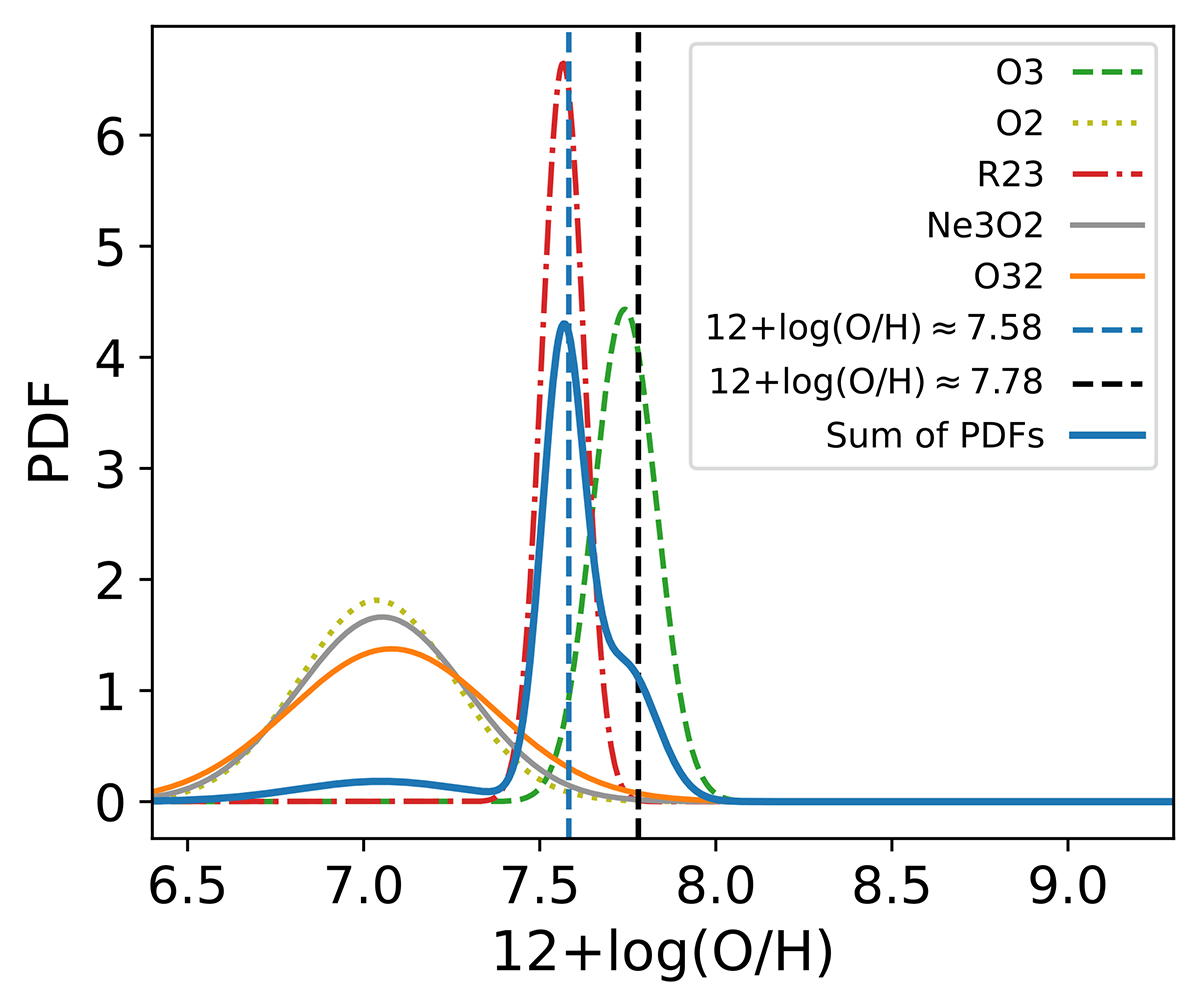
Normalized probability density functions (PDFs) for each metallicity calculation. Blue and black vertical lines represent the 12 + log(O/H) values calculated using the strong-line calibrations method by Sanders et al. (2024) and Te method, respectively.
Current usage metrics show cumulative count of Article Views (full-text article views including HTML views, PDF and ePub downloads, according to the available data) and Abstracts Views on Vision4Press platform.
Data correspond to usage on the plateform after 2015. The current usage metrics is available 48-96 hours after online publication and is updated daily on week days.
Initial download of the metrics may take a while.