Open Access
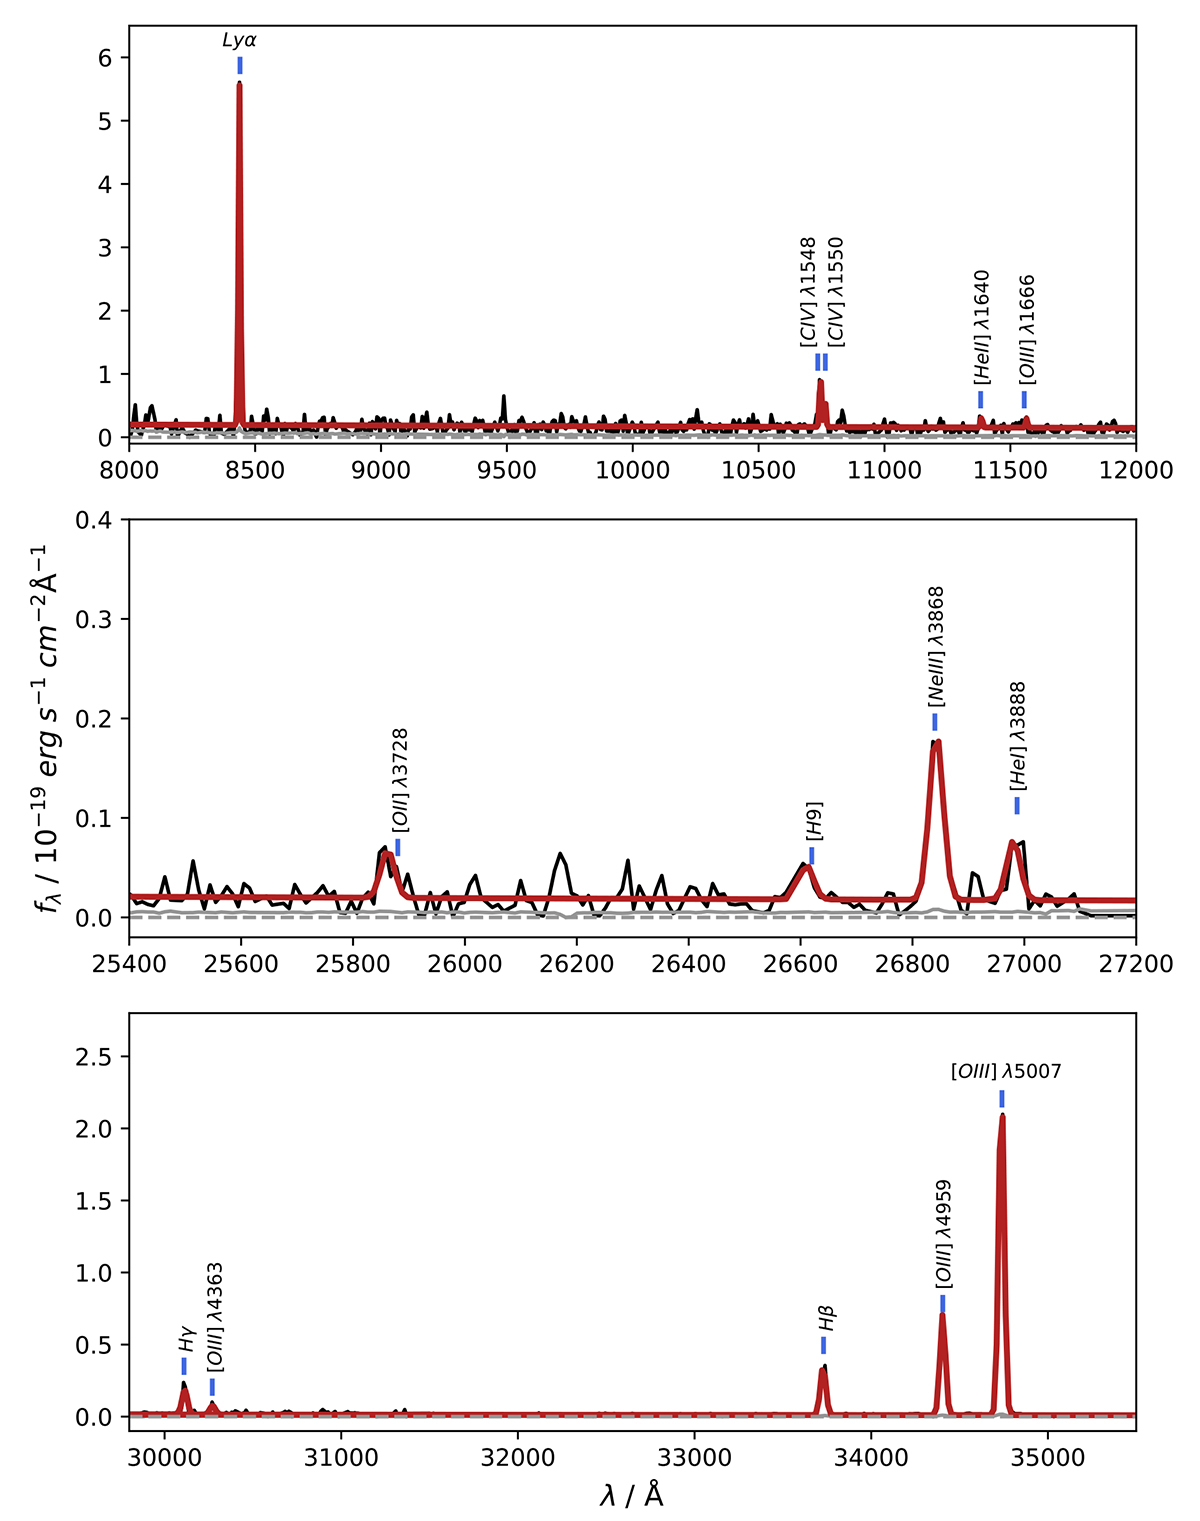
Fig. 1.
Download original image
Zoomed-in views of the regions of medium-resolution gratings with the main nebular and auroral emission line transitions marked. The best-fit continuum and Gaussian profiles to each line transition are shown by the solid red line.
Current usage metrics show cumulative count of Article Views (full-text article views including HTML views, PDF and ePub downloads, according to the available data) and Abstracts Views on Vision4Press platform.
Data correspond to usage on the plateform after 2015. The current usage metrics is available 48-96 hours after online publication and is updated daily on week days.
Initial download of the metrics may take a while.