Fig. 6
Download original image
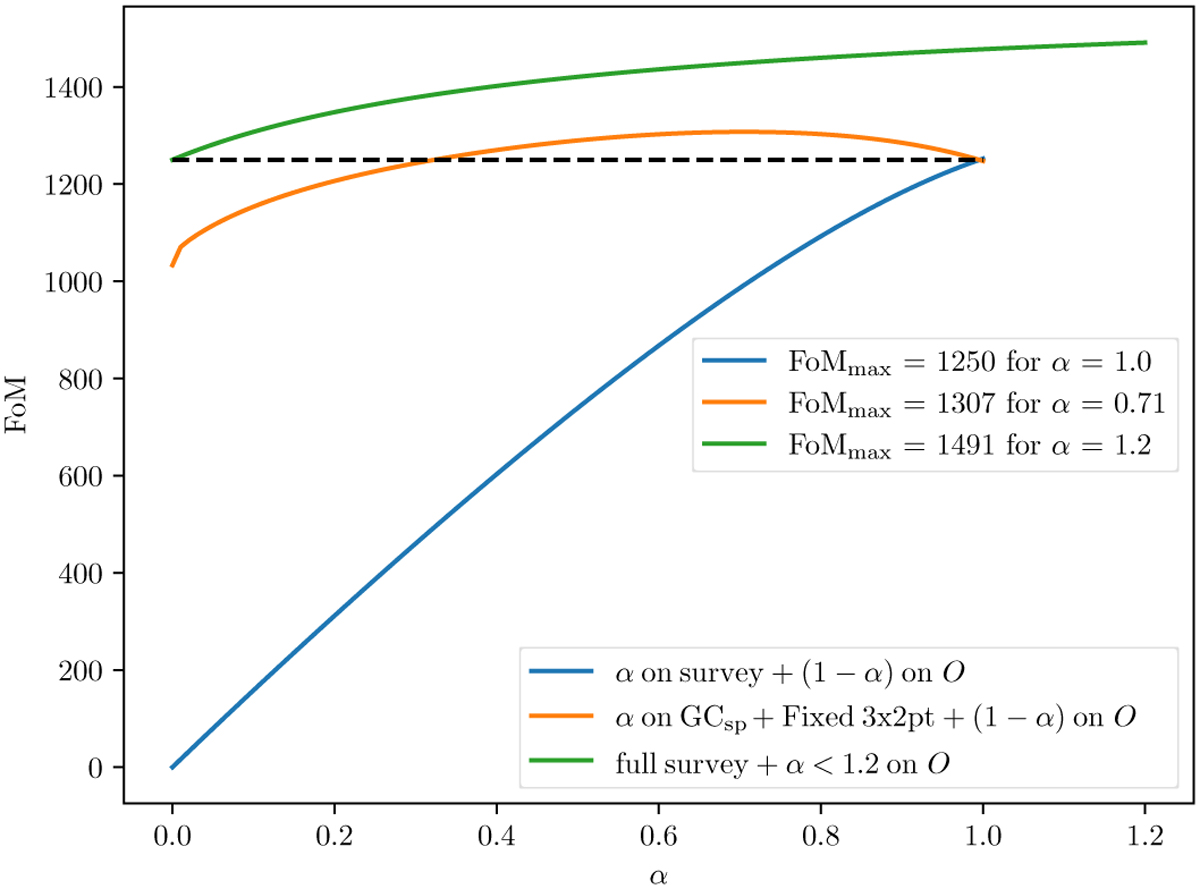
Figure-of-Merit (FoM) as a function of the fraction α of Euclid’s observed sky (fsky). The blue curve represents the combination of a fraction α for the main probes (GCsp and 3×2pt) and (1 – α) for the new observable O. The orange curve represents the combination of a fraction of α for GCsp, together with the full 3×2pt analysis for the full survey and a contribution of (1 – α) for the new observable O. The green curve shows the FoM of the full survey with an additional external contribution from the new observable up to a factor or = 1.2. The dashed line represents the optimal FoM using the standard GCsp and 3×2pt analysis. See the text for additional details on the different cases.
Current usage metrics show cumulative count of Article Views (full-text article views including HTML views, PDF and ePub downloads, according to the available data) and Abstracts Views on Vision4Press platform.
Data correspond to usage on the plateform after 2015. The current usage metrics is available 48-96 hours after online publication and is updated daily on week days.
Initial download of the metrics may take a while.