Fig. 1
Download original image
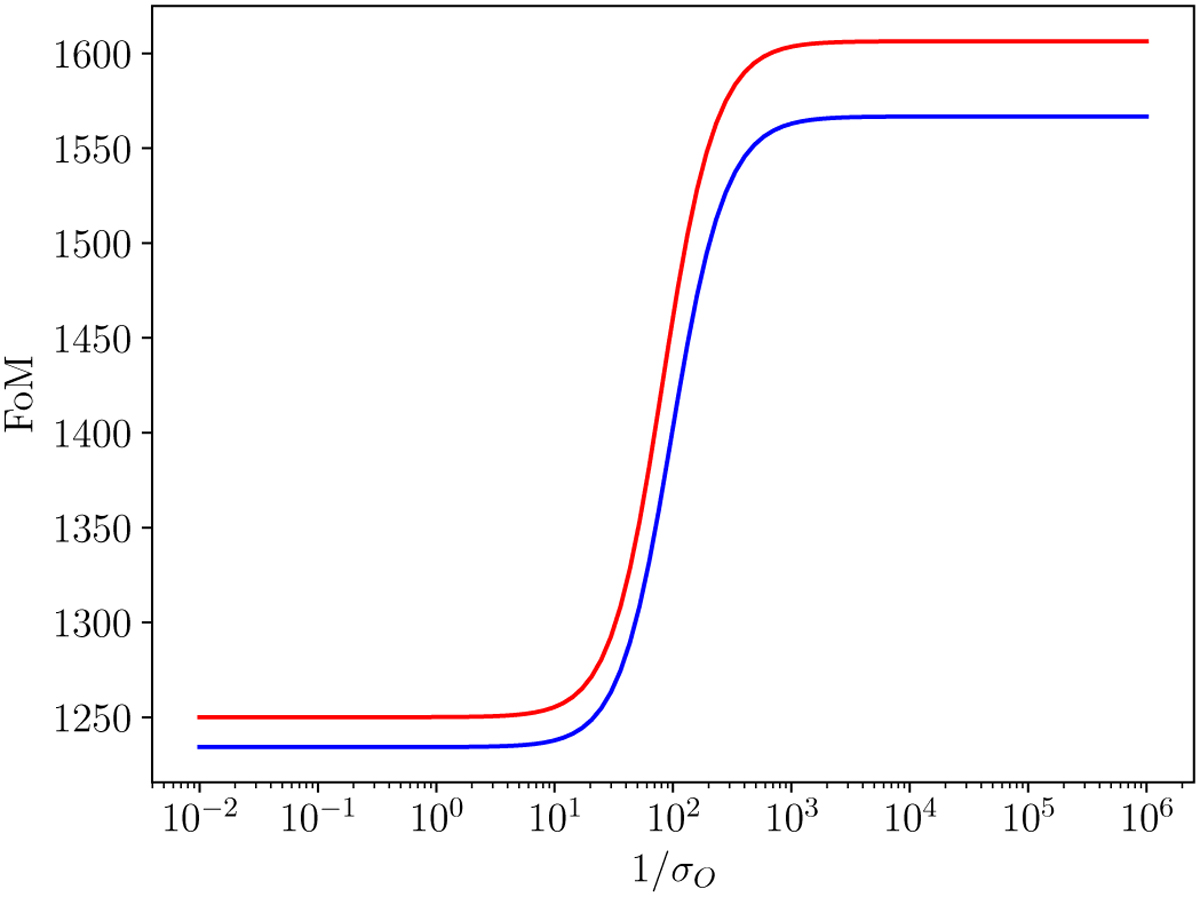
Evolution of the FoM as a function of the inverse of the standard deviation of the new observable, for the test cases considered in Sect. 5.2. In blue, the case where fiducial values of the spectroscopic biases are taken to be equal to the photometric biases (bottom plateau at FoM=1234 and top plateau at FoM=1567). In red, the case with different fiducial values of the spectroscopic biases and photometric biases following the baseline of EP:VII (bottom plateau at FoM=1250 and top plateau at FoM=1606). The FoM includes the information from GCsp, 3×2 pt, and the new observable.
Current usage metrics show cumulative count of Article Views (full-text article views including HTML views, PDF and ePub downloads, according to the available data) and Abstracts Views on Vision4Press platform.
Data correspond to usage on the plateform after 2015. The current usage metrics is available 48-96 hours after online publication and is updated daily on week days.
Initial download of the metrics may take a while.