Fig. C.7
Download original image
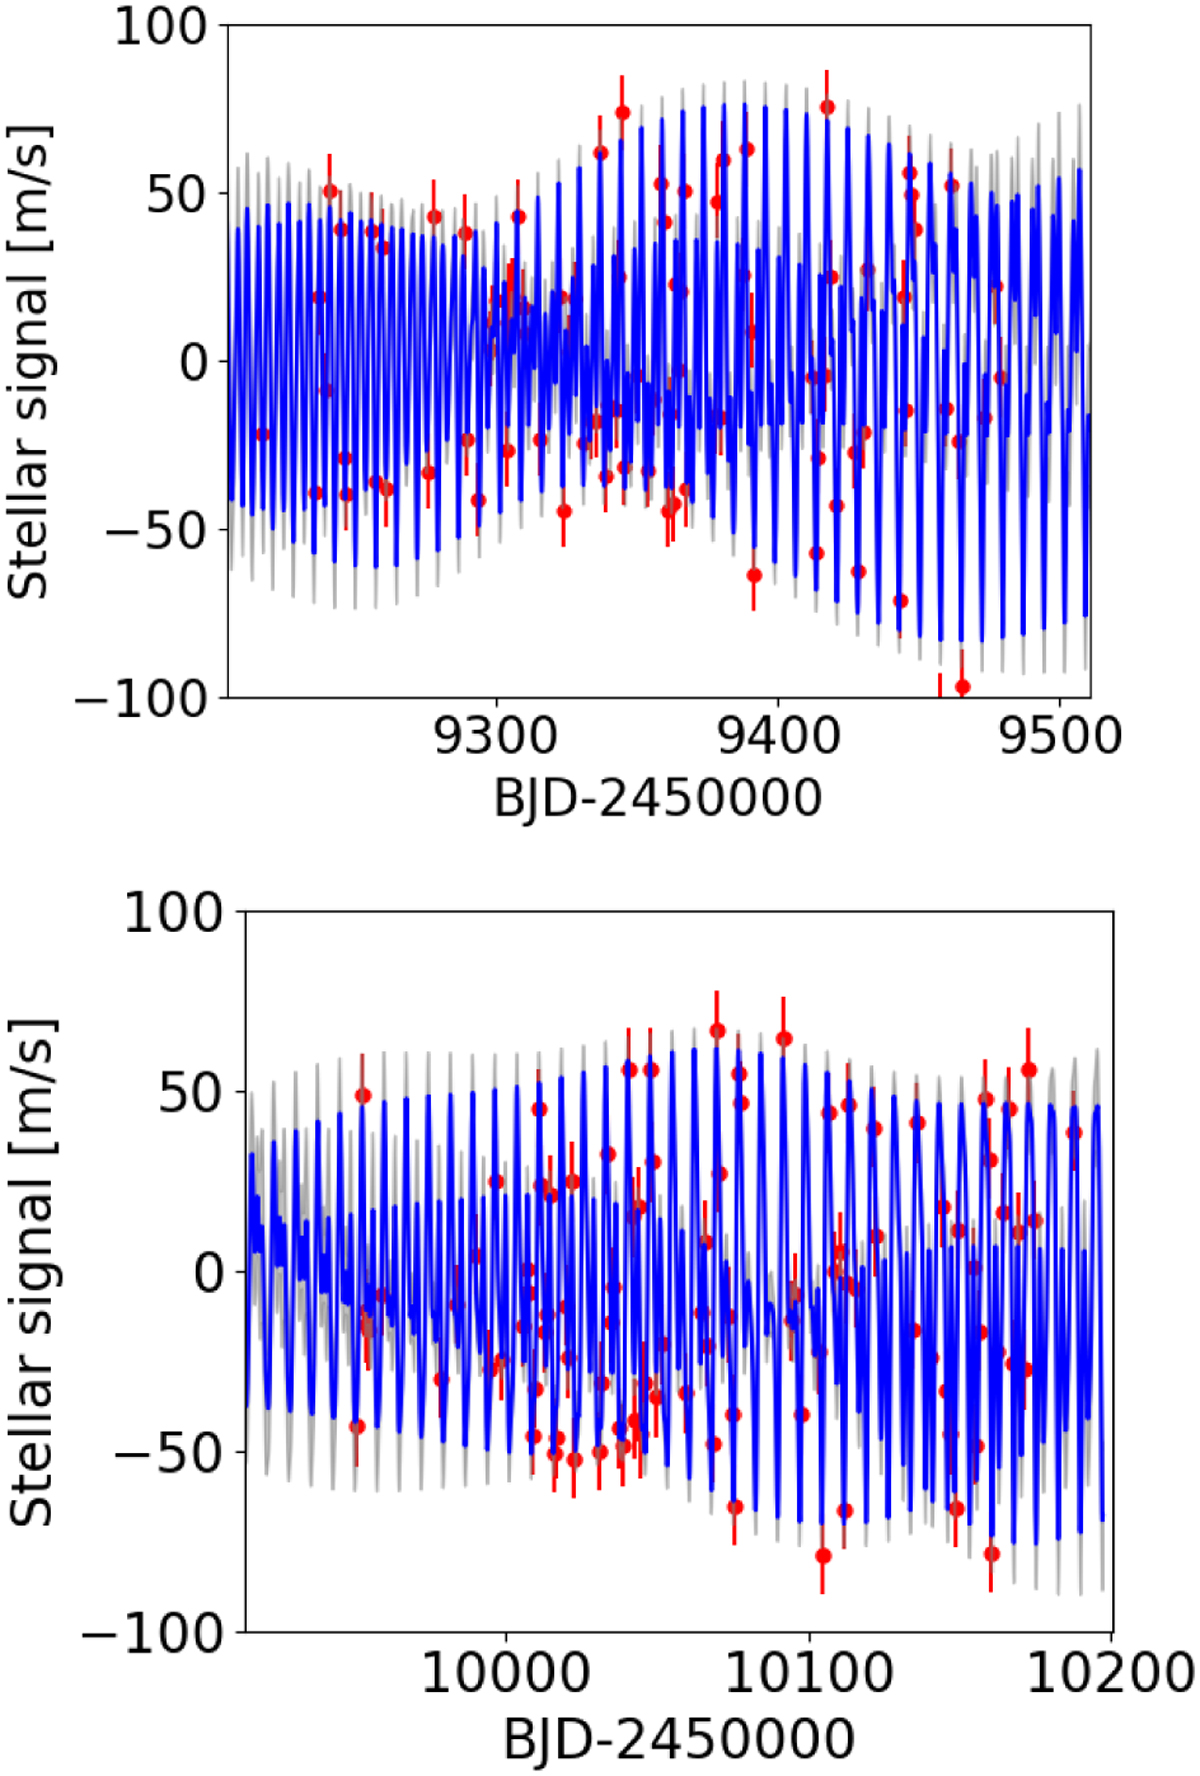
Examples of the stellar activity component in the HARPS-N RV time series (SERVAL, all echelle orders) as fitted through a GP regression using a quasi-periodic kernel (the first and third observing season are shown). The curve in blue represents the GP best-fit model; the grey area is 1σ confidence interval. The RV error bars include a jitter term (11 ms−1) added in quadrature to the measurement uncertainties.
Current usage metrics show cumulative count of Article Views (full-text article views including HTML views, PDF and ePub downloads, according to the available data) and Abstracts Views on Vision4Press platform.
Data correspond to usage on the plateform after 2015. The current usage metrics is available 48-96 hours after online publication and is updated daily on week days.
Initial download of the metrics may take a while.