Fig. A.1
Download original image
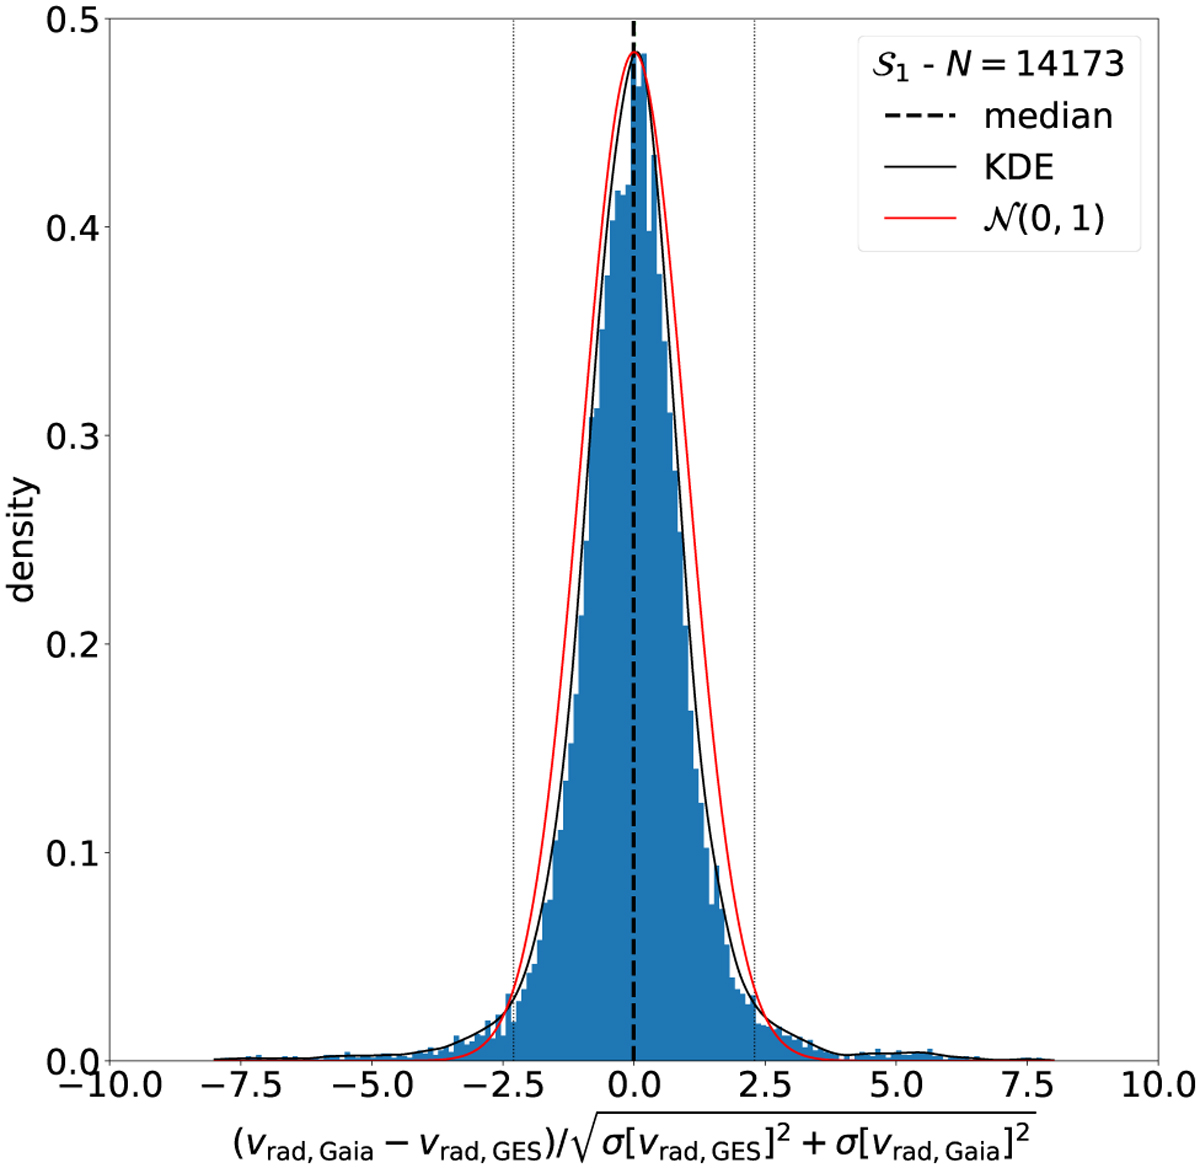
Probability distribution of the normalised velocity differences. The blue histogram (bin width = 0.1) displays the distribution Δnormυrad of the difference of the radial velocity differences υrad,Gaia − υrad,GES normalised by the propagated errors ![]() where σcorr[υradGES] is the uncertainty corrected according to Babusiaux et al. (2023). The black line is the empirical KDE obtained from the sample distribution. The red line is the probability distribution function (PDF) of a the normal law centred in 0 and of unit variance. The dashed vertical black line indicates the mean of the distribution. The black dotted lines have equation |Δnormυrad| = 2.3 and show where the tails of the empirical distribution become heavier than those of the normal law.
where σcorr[υradGES] is the uncertainty corrected according to Babusiaux et al. (2023). The black line is the empirical KDE obtained from the sample distribution. The red line is the probability distribution function (PDF) of a the normal law centred in 0 and of unit variance. The dashed vertical black line indicates the mean of the distribution. The black dotted lines have equation |Δnormυrad| = 2.3 and show where the tails of the empirical distribution become heavier than those of the normal law.
Current usage metrics show cumulative count of Article Views (full-text article views including HTML views, PDF and ePub downloads, according to the available data) and Abstracts Views on Vision4Press platform.
Data correspond to usage on the plateform after 2015. The current usage metrics is available 48-96 hours after online publication and is updated daily on week days.
Initial download of the metrics may take a while.