Fig. 31
Download original image
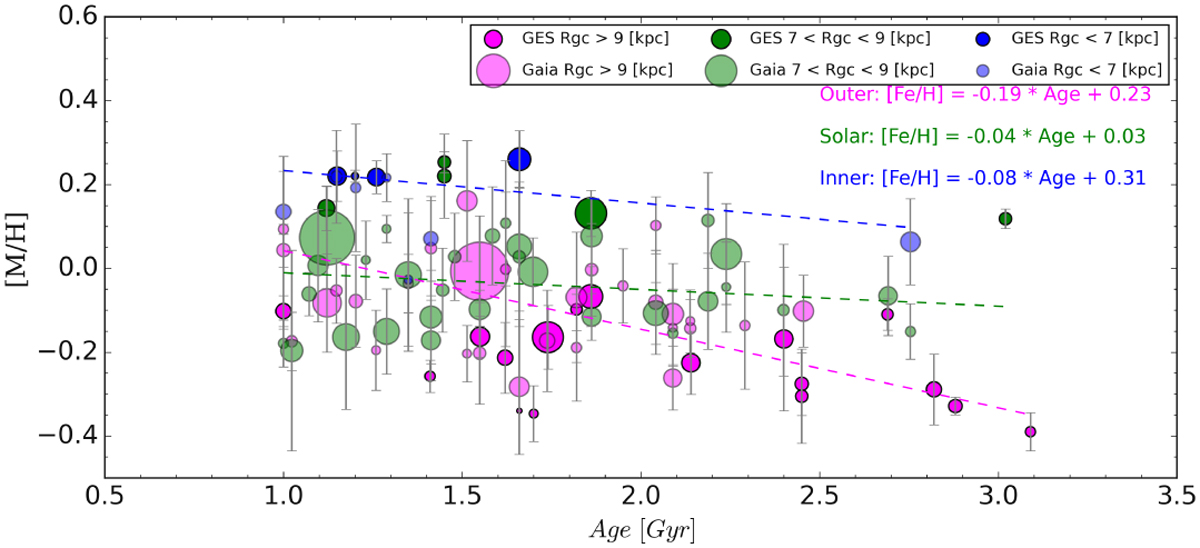
Age-Metallicity relation for the sample of clusters with ages between 1 and 3 Gy, divided in three radial bins. The clusters observed by Gaia are represented with semi-transparent circles, while those observed by GES with solid-filled circles. The linear regressions are shown with dashed lines using the same colour as the corresponding radial bin. In the plot, we show the coefficients of the three age-metallicity relationships. The size of the symbols is proportional of the number of member stars used to compute the mean values.
Current usage metrics show cumulative count of Article Views (full-text article views including HTML views, PDF and ePub downloads, according to the available data) and Abstracts Views on Vision4Press platform.
Data correspond to usage on the plateform after 2015. The current usage metrics is available 48-96 hours after online publication and is updated daily on week days.
Initial download of the metrics may take a while.