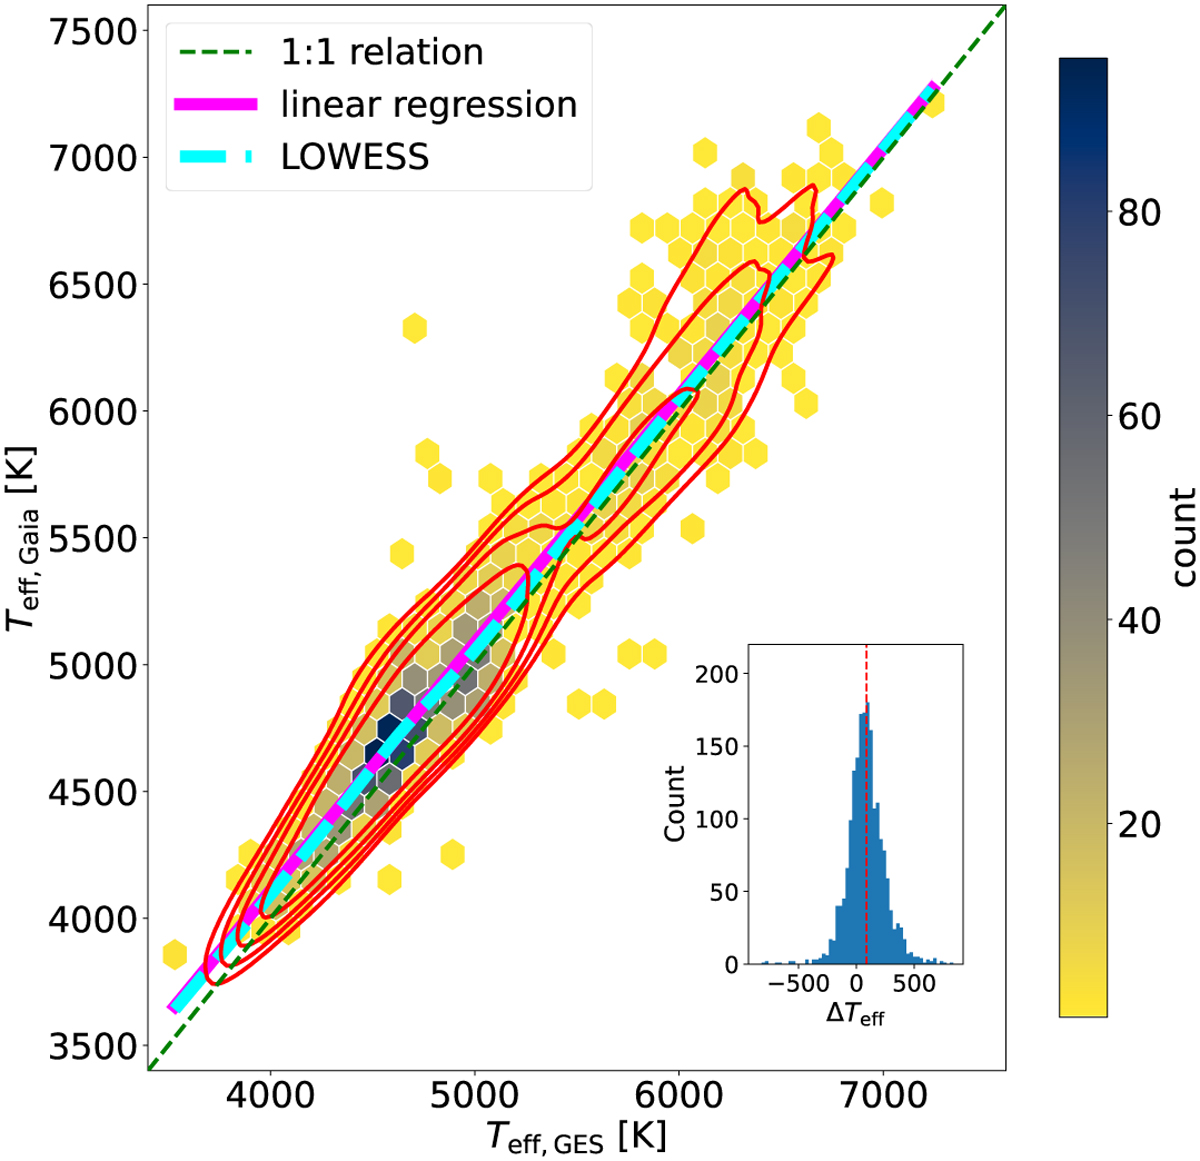
Fig. 11

Download original image
Comparison of the effective temperatures for the 1939 stars of 𝒮3 with both a Gaia GSP-Spec and GES temperature estimate. The 2D hexagonal bins are colour-coded by the number of stars. The red lines show density levels containing 68, 80, 90 and 95% of the population. The dashed green line shows the 1-to-1 relation, the pink thick line is the linear regression (see text for the parametrisation). The cyan thick dashed line is the LOWESS line. The inset shows the distribution of Δeff = Teff,Gaia − Teff,GES.
Current usage metrics show cumulative count of Article Views (full-text article views including HTML views, PDF and ePub downloads, according to the available data) and Abstracts Views on Vision4Press platform.
Data correspond to usage on the plateform after 2015. The current usage metrics is available 48-96 hours after online publication and is updated daily on week days.
Initial download of the metrics may take a while.


