Fig. 10
Download original image
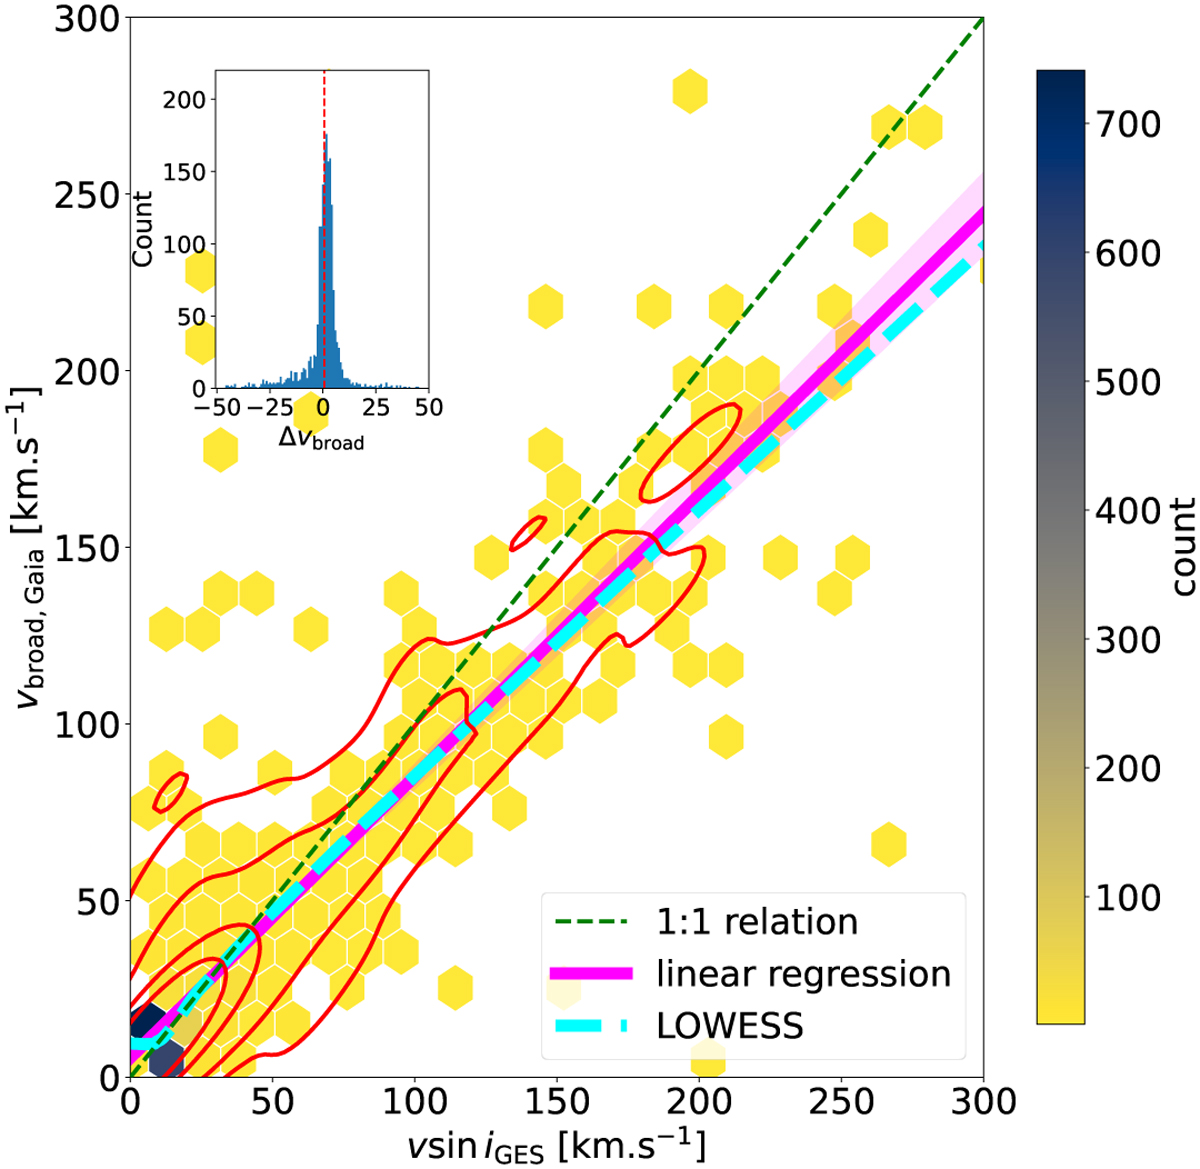
υbroad,Gaia vs υ sin iGES (2D histogram). The green dashed line is the 1-to-1 relation. The pink thick line is the linear regression (see text for the parametrisation). The cyan thick dashed line is a non-parametric LOWESS model (locally weighted linear regression) implemented using the Python module StatsModels. The inset shows the distribution of Δυbroad = υbroad,Gaia − υ sin iGES. The red dashed line in the inset indicates the location of the mean difference.
Current usage metrics show cumulative count of Article Views (full-text article views including HTML views, PDF and ePub downloads, according to the available data) and Abstracts Views on Vision4Press platform.
Data correspond to usage on the plateform after 2015. The current usage metrics is available 48-96 hours after online publication and is updated daily on week days.
Initial download of the metrics may take a while.