Fig. 1.

Download original image
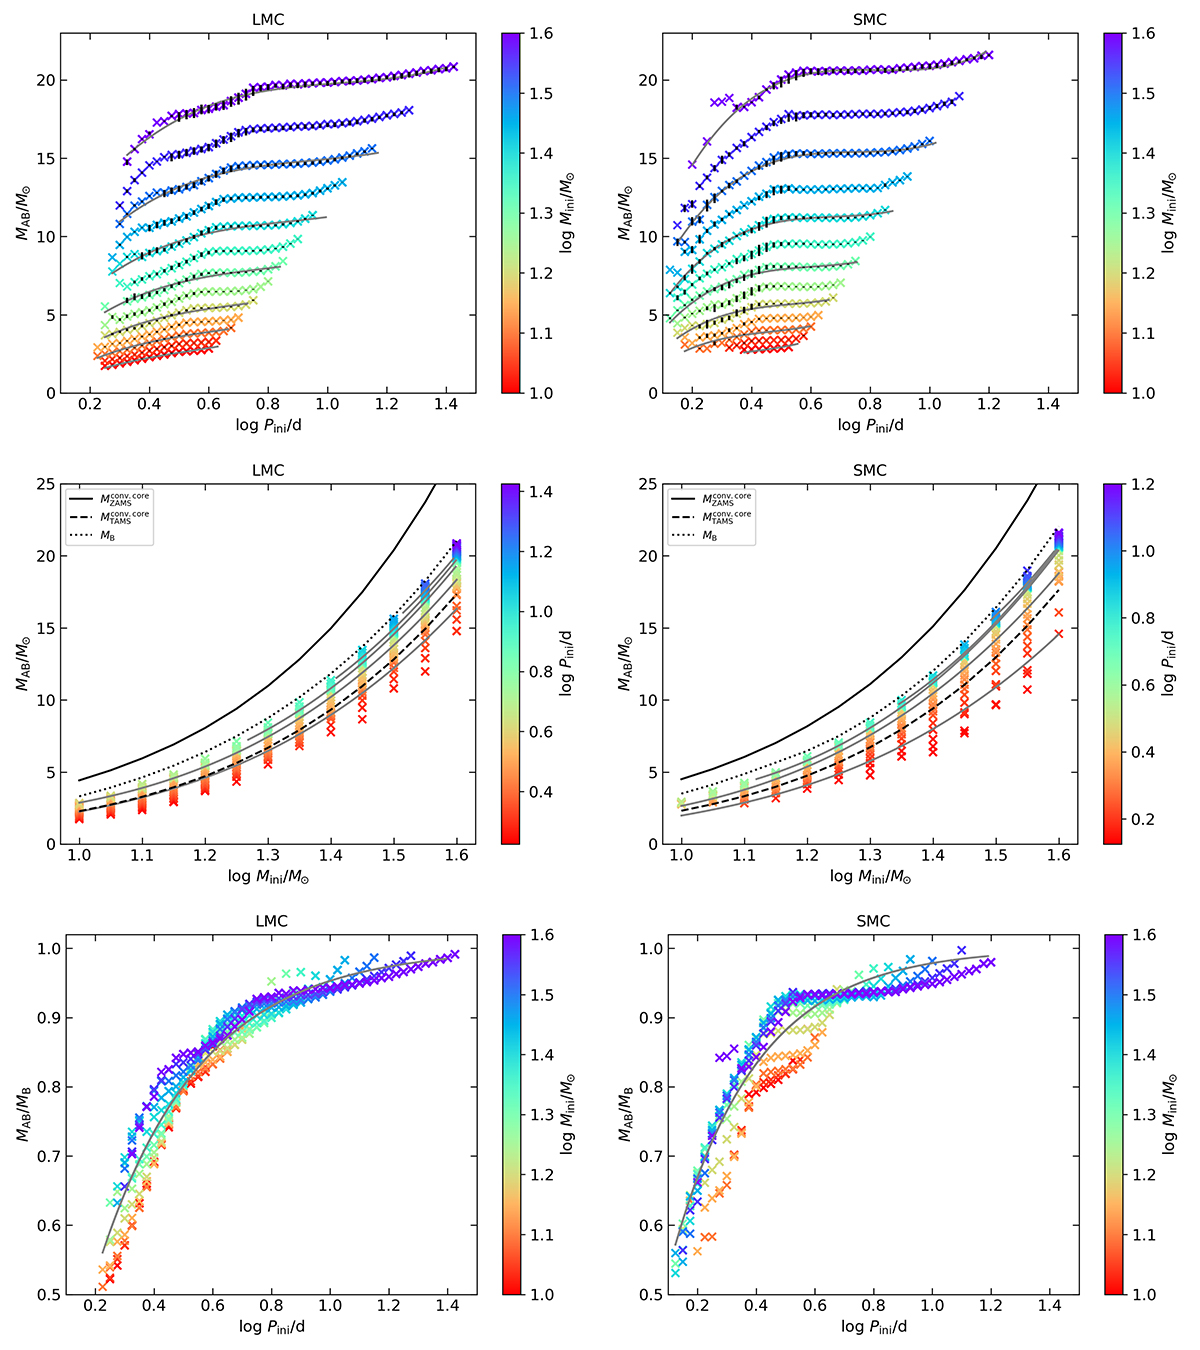
Donor mass immediately after Case AB mass transfer (MAB) in units of the solar mass (top and middle) and in units of the donor mass after Case B mass transfer (MB, bottom), as a function of the initial orbital period Pini, with the initial donor mass Mini colour-coded (top and bottom). The middle panel shows MAB as a function of the initial donor mass, where models with the same initial orbital period are indicated with the same colour. Each cross represents the median of MAB across different initial mass ratios and in the top plots we indicted in black its interquartile range (distance from first to third quartile of the mass ratio distribution). In the middle plots the black lines show the mass of the convective cores of single stars at the beginning (MZAMSconv.core) and the end (MTAMSconv.core) of core hydrogen-burning, as well as the mass after Case B mass transfer, as a function of the initial stellar mass. Grey lines indicate our best fit to the data. The panels on the left show LMC models, and on the right SMC show models.
Current usage metrics show cumulative count of Article Views (full-text article views including HTML views, PDF and ePub downloads, according to the available data) and Abstracts Views on Vision4Press platform.
Data correspond to usage on the plateform after 2015. The current usage metrics is available 48-96 hours after online publication and is updated daily on week days.
Initial download of the metrics may take a while.


