Fig. 5.
Download original image
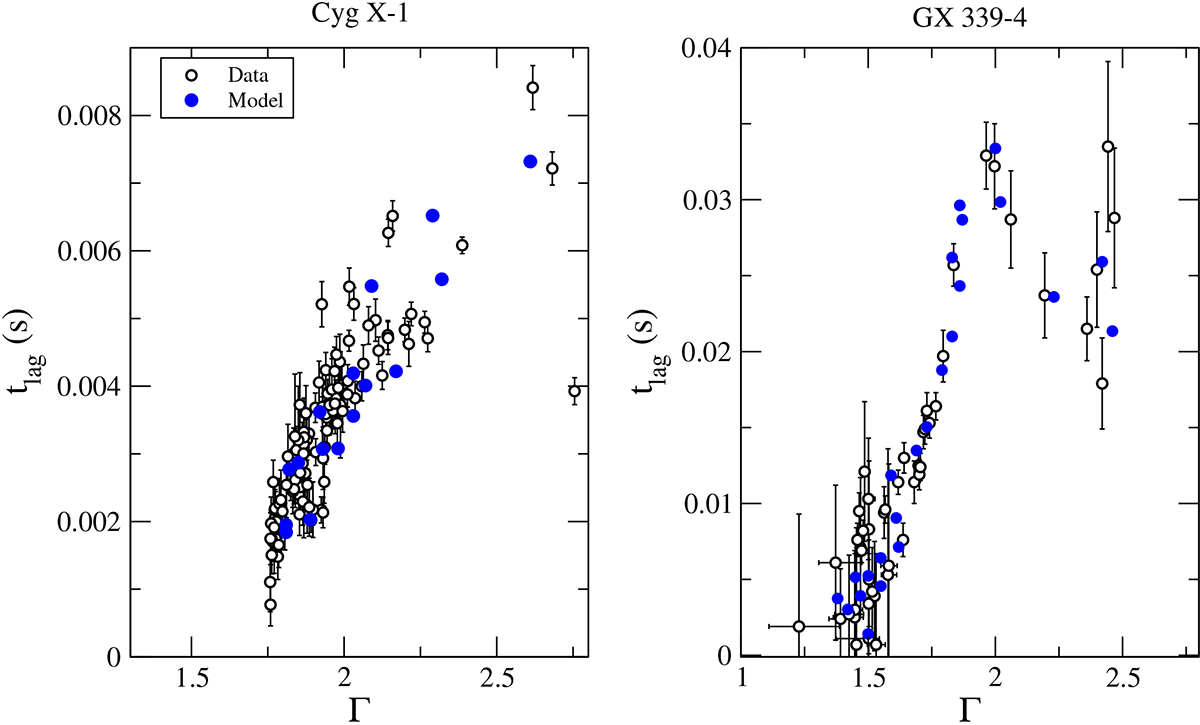
Correlation between time lag and photon index, Γ, for Cyg X–1 (left) and GX 339–4 (right). The data for Cyg X–1 come from Pottschmidt et al. (2003, see also Kylafis et al. 2008) and for GX 339–4 from Kylafis & Reig (2018). Black empty circles represent the observations, and the filled blue circles correspond to the models, which are produced with γ0 = 1.14 and the values of τ∥ and R0 that are shown in Fig. 6.
Current usage metrics show cumulative count of Article Views (full-text article views including HTML views, PDF and ePub downloads, according to the available data) and Abstracts Views on Vision4Press platform.
Data correspond to usage on the plateform after 2015. The current usage metrics is available 48-96 hours after online publication and is updated daily on week days.
Initial download of the metrics may take a while.