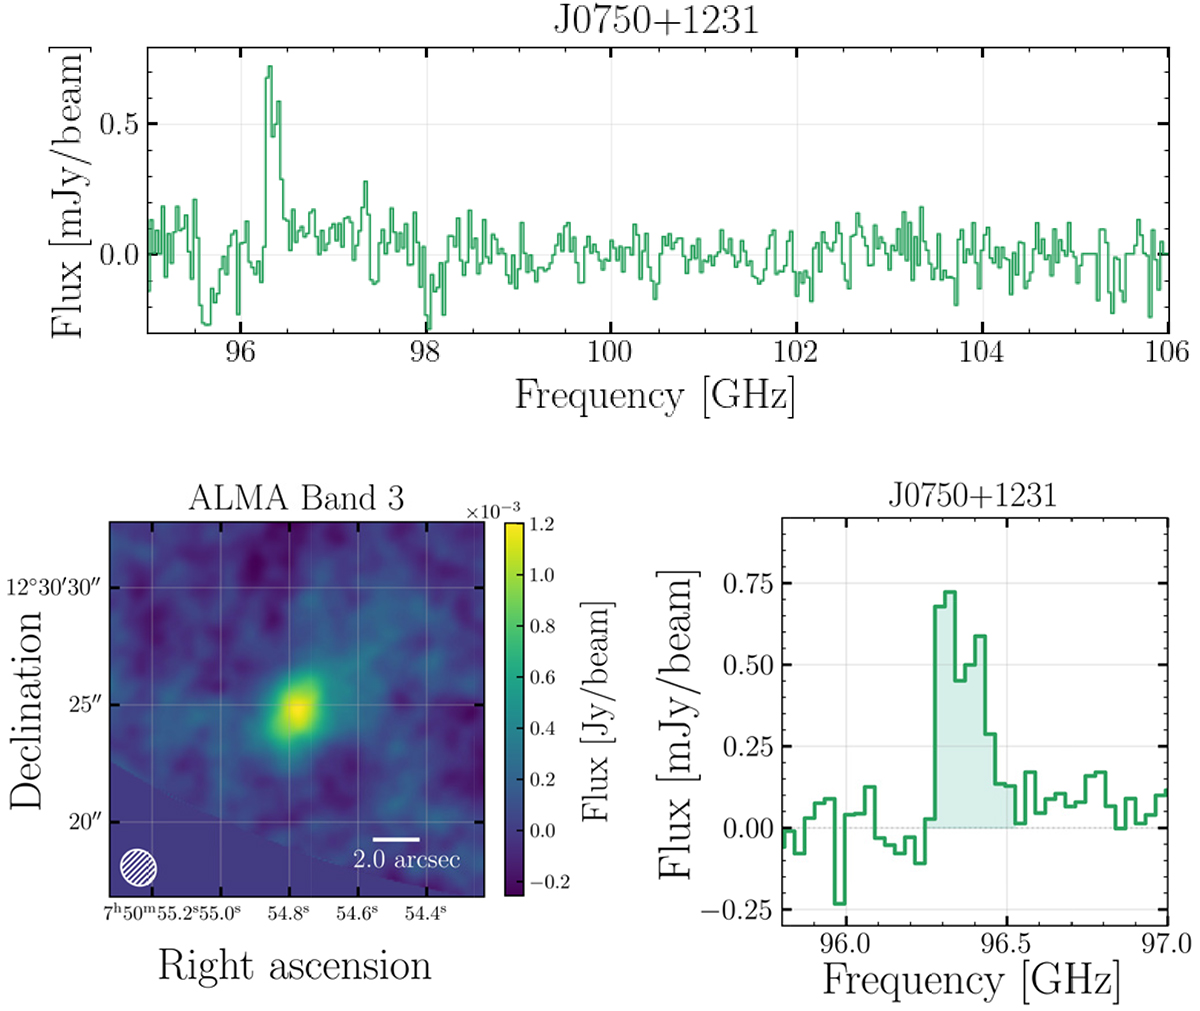
Fig. 8.
Download original image
Example of an ALMACAL−22 data cube from the updated sample with a prominent emission line found in the calibrator field. The top panel shows the full spectral coverage of the region of the data cube where the emission line was found. The lower left panel displays a region of the continuum map of the calibrator field in Band 3, centred on the position of the emission line. The lower right panel shows the emission line, where the shaded region represents the line width reaching a S/N ∼9.
Current usage metrics show cumulative count of Article Views (full-text article views including HTML views, PDF and ePub downloads, according to the available data) and Abstracts Views on Vision4Press platform.
Data correspond to usage on the plateform after 2015. The current usage metrics is available 48-96 hours after online publication and is updated daily on week days.
Initial download of the metrics may take a while.