| Issue |
A&A
Volume 675, July 2023
|
|
|---|---|---|
| Article Number | L10 | |
| Number of page(s) | 8 | |
| Section | Letters to the Editor | |
| DOI | https://doi.org/10.1051/0004-6361/202347107 | |
| Published online | 19 July 2023 | |
Letter to the Editor
ALMACAL
XI. Over-densities as signposts for proto-clusters? A cautionary tale
1
European Southern Observatory (ESO), Karl-Schwarzschild-Strasse 2, 85748 Garching, Germany
e-mail: Jianhang.Chen@eso.org; cjhastro@gmail.com
2
Department of Physics and Astronomy, Macquarie University, North Ryde, NSW, Australia
3
School of Cosmic Physics, Dublin Institute for Advanced Studies, 31 Fitzwilliam Place, Dublin D02 XF86, Ireland
4
Institute for Astronomy, University of Edinburgh, Royal Observatory, Blackford Hill, Edinburgh EH9 3HJ, UK
5
ARC Centre of Excellence for All Sky Astrophysics in 3 Dimensions (ASTRO 3D), Australia
6
DARK, Niels Bohr Institute, University of Copenhagen, Jagtvej 128, 2200 Copenhagen, Denmark
7
Aix Marseille Université, CNRS, LAM (Laboratoire d’Astrophysique de Marseille) UMR 7326, 13388 Marseille, France
8
Institute of Cosmology and Gravitation, University of Portsmouth, Burnaby Road, Portsmouth PO1 3FX, UK
9
Astronomy Centre, University of Sussex, Falmer, Brighton BN1 9QH, UK
10
International Centre for Radio Astronomy Research (ICRAR), M468, University of Western Australia, 35 Stirling Hwy, Crawley, WA 6009, Australia
11
Cosmic Dawn Center (DAWN), Denmark
12
UK Astronomy Technology Centre, Royal Observatory, Blackford Hill, Edinburgh EH9 3HJ, UK
Received:
6
June
2023
Accepted:
29
June
2023
It may be unsurprising that the most common approach to finding proto-clusters is to search for over-densities of galaxies. Upgrades to submillimetre (submm) interferometers and the advent of the James Webb Space Telescope will soon offer the opportunity to find more distant candidate proto-clusters in deep sky surveys without any spectroscopic confirmation. In this Letter, we report the serendipitous discovery of an extremely dense region centred on the blazar, J0217−0820, at z = 0.6 in the ALMACAL sky survey. Its density is eight times higher than that predicted by blind submm surveys. Among the seven submm-bright galaxies, three are as bright as conventional single-dish submm galaxies, with S870 μm > 3 mJy. The over-density is thus comparable to the densest known and confirmed proto-cluster cores. However, their spectra betray a wide range of redshifts. We investigate the likelihood of line-of-sight projection effects using light cones from cosmological simulations, finding that the deeper we search, the higher the chance that we will suffer from such projection effects. The extreme over-density around J0217−0820 demonstrates the strong cosmic variance we may encounter in the deep submm surveys. Thus, we should also question the fidelity of galaxy proto-cluster candidates selected via over-densities of galaxies, where the negative K correction eases the detection of dusty galaxies along an extraordinarily extended line of sight.
Key words: galaxies: clusters: general / submillimeter: galaxies / large-scale structure of Universe / galaxies: high-redshift / galaxies: distances and redshifts / galaxies: general
© The Authors 2023
 Open Access article, published by EDP Sciences, under the terms of the Creative Commons Attribution License (https://creativecommons.org/licenses/by/4.0), which permits unrestricted use, distribution, and reproduction in any medium, provided the original work is properly cited.
This article is published in open access under the Subscribe to Open model. Subscribe to A&A to support open access publication.
1. Introduction
Cosmological models predict the hierarchical evolution of structure across cosmic time. Proto-clusters of galaxies are supposedly the earliest over-densities to take shape, to form stars and (one way or another) to light up. They should serve as excellent tracers of early structure formation, as they are believed to evolve into the most massive clusters in today’s Universe (see reviews in Overzier 2016; Alberts & Noble 2022).
For the few examples known, their extreme over-densities and active ongoing star formation are consistent with model predictions for dense nodes at intersections of the so-called ‘cosmic web’ (Bond et al. 1996). Their activity is indicative of feeding by cold streams of gas from this web, which somehow sustains vigorous star formation and nurses the growth of super-massive black holes (e.g., Dekel et al. 2009). Proto-clusters are thus ideal laboratories for studying the interplay between baryons and various feedback processes.
Traditionally (and for obvious reasons) statistical over-densities of galaxies have been used to identify proto-clusters. Pioneering studies have utilised broad-band photometry to search for over-densities of Lyman-break galaxies (LBGs, e.g., Steidel et al. 1998), leading to the discovery of giant structures such as that at z = 3.1 in the SSA 22 field. Many more were found subsequently via deep narrow-band surveys, searching for various strong line emitters, such as Ly α emitters (e.g. Steidel et al. 2000; Matsuda et al. 2004; Ouchi et al. 2005) and H α emitters (e.g. Kurk et al. 2004; Tanaka et al. 2011; Hayashi et al. 2012). Large multi-band photometric surveys have also inspired selection based on colour (e.g. Zirm et al. 2008; Capak et al. 2011; Wylezalek et al. 2013a; Laporte et al. 2022). Those surveys have preferentially targeted existing massive galaxies or structures, such as high-redshift radio galaxies (HzRGs), quasars, and giant Lyα blobs (LABs). Among them, HzRGs are known to be hosted by massive galaxies (Seymour et al. 2007) and are therefore thought to trace the most massive dark matter halos. Indeed, they have often been found to signpost over-dense regions and are frequently embedded in proto-clusters (e.g., Stevens et al. 2003; Miley & De Breuck 2008). We also know that LABs are giant structures, sometimes extending several hundred kpc from the central engine. They are widely thought to be powered by starbursts and/or strong active galactic nuclei (AGN) feedback, both preferentially triggered in denser environments (e.g., Overzier et al. 2013; Umehata et al. 2019). Specifically, in the proto-typical proto-cluster, known as the Spiderweb at z = 2.2, all these methods have been used to reveal various galaxy populations (Kurk et al. 2000, 2004; Pentericci et al. 2002; Zirm et al. 2008; Hatch et al. 2011).
Contemporaneously, advances in detector technology at submillimetre (submm) wavelengths led to the discovery of submm galaxies (so called SMGs, Smail et al. 1997; Hughes et al. 1998; Barger et al. 1998). These galaxies were initially selected at 850 μm and were eventually found to be dominated by distant z > 1 dusty starburst galaxies, forming stars at over > 100 M⊙ yr−1, thereby revolutionising our understanding of the most intense star-forming galaxies at high redshift (see the review by Hodge & da Cunha 2020). Due to their extreme star formation rates (SFRs) and massive gas reservoirs, SMGs are thought to trace peaks in the underlying density field and are viewed as the most likely precursors of present-day ellipticals (e.g., Lilly et al. 1999; Swinbank et al. 2006), which has made them another intriguing potential signpost for proto-clusters. Because of this, searches for SMGs in known proto-cluster environments – as well as for galaxy over-densities around SMGs – have been popular ways to find proto-clusters and study their evolutionary status (e.g., Dannerbauer et al. 2014; Umehata et al. 2018; Calvi et al. 2023).
Recent advances in submm interferometry have accelerated the confirmation and resolved studies of the most extreme and rare proto-cluster cores. Proto-cluster cores are supposed to be the densest known galaxy structures in the early Universe, likely tracing the cores of the most massive dark matter halos. These rare galaxy over-densities were first discovered as single bright sources by single-dish telescopes with limited spatial resolution, then later resolved into typically a dozen starburst galaxies via deeper interferometric observations. In the Distant Red Core (DRC) at z = 4.0, for example, first identified via imaging with Herschel, the James Clerk Maxwell Telescope (JCMT) and APEX by Ivison et al. (2016), 12 SMGs were later confirmed in the central 300 kpc region, along with four more gas-rich galaxies in the outskirts (e.g., Oteo et al. 2018; Ivison et al. 2020); in SPT 2349−56, at z = 4.3, 14 dusty star-forming galaxies were found gathered within a 130-kpc region (Miller et al. 2018). These recent observational breakthroughs suggest that we may be witnessing the most extreme evolutionary stage of a proto-cluster, where the central region is being transformed into something typical of today’s clusters: a massive central cD-type galaxy, such as NGC 1275 in the Perseus cluster. With the advent of the James Webb Space Telescope (JWST), we are likely to find many more such systems at higher redshifts (e.g., Laporte et al. 2022; Jin et al. 2023; Morishita et al. 2023; Helton et al. 2023).
However, the number of confirmed proto-clusters remains limited. Due to the expense of the spectroscopic follow-up required to confirm the redshifts of member galaxies, searching for projected over-densities remains the most commonly used technique for identifying proto-clusters (e.g., Lammers et al. 2022). Because they can cover larger areas than interferometers, single-dish submm telescopes continue to target promising candidates: for instance, HzRGs, LABs, as well as over-densities found at other wavelengths, searching for additional SMGs (e.g., Robson et al. 2014; MacKenzie et al. 2017; Zeballos et al. 2018; Li et al. 2020, 2023; Wang et al. 2021; Nowotka et al. 2022; Zhang et al. 2022). Over-densities have been reported in many of these systems, although the densities are only marginally higher than those of the control fields and further follow-up often gives mixed results. For instance, Wylezalek et al. (2013b) used far-IR/submm spectral energy distributions (SEDs) to constrain the redshifts of galaxies towards the z = 3.8 radio galaxy, 4C 41.17, finding just one of the many neighbouring far-IR galaxies to be at similar redshift as 4C 41.17, with most of the sources in the foreground. Similar false confirmations have also been reported in several proto-cluster candidates (Chapman et al. 2015; Meyer et al. 2022).
In this Letter, we report the discovery of an extreme over-density within the ALMACAL survey: seven point-like sources around an ALMA calibration source, namely, the blazar, ICRF J021702.6−082052, at z = 0.6 (hereafter, J0217−0820). Six of these are shown to be dusty star-forming galaxies (DSFGs) based on multi-band submm photometry. The over-density is comparable to the most extreme known, confirmed proto-cluster cores.
First, we summarise the ALMACAL survey and the data used in this work, in Sect. 2. We describe the over-density of submm galaxies around J0217−0820 in Sect. 3. We unveil the redshifts of those galaxies in Sect. 4, then we discuss the conclusions and implications in Sect. 5, using lightcones made from recent cosmological simulations to better understand the statistics.
2. ALMA data and their analysis
ALMACAL exploits ‘free’ calibration data to monitor the ALMA calibration sources (most of which are blazars) and survey their immediate vicinities (Zwaan et al. 2022). The ALMA calibrators are distributed fairly randomly across the sky, serving to calibrate the bandpass response, complex gains, the flux density scale, and the degree and angle of polarisation. Overall, ≈20% of the available ALMA telescope time is and has been spent on calibrators. For some calibrators, the depth reached by combining all the available visits is comparable with the deepest cosmological fields. Since calibration scans typically cover many frequencies, the resulting spectral coverage can be considerable, offering the opportunity to search for spectral lines. Towards the calibrator, J1058+0133, for example, Oteo et al. (2017) found two SMGs and detected a host of spectral lines, yielding a remarkable spectral line energy distribution. Towards the calibrator J0238+1636, Klitsch et al. (2019) observed multiple CO emission lines around one Lyα absorber, which shows excited interstellar medium.
Chen et al. (2023) conducted a multi-band survey for dusty starbursts as part of the ALMACAL project. J0217−0820 was the densest region found among the available ALMACAL footprints. Until August 2022, around 8.6 h of data had accumulated. Combining these data, ALMA has sampled the spectrum from band 3 to band 7. In band 7, the 1-σ depth reaches 13 μJy beam−1. Within d = 30″ around the centre, seven continuum sources have been found (> 5σ significance), including three at S870μm > 1 mJy, which we will call traditional SMGs, following Hodge & da Cunha (2020), and three fainter sources, which we refer to as DSFGs (see also Table 1).
Observed properties of the seven objects and the blazar.
The data retrieval and calibration in J0217−0820 is similar to the scheme described in Oteo et al. (2016). In summary, we first collected all the observations that used J0217−0820 as a calibrator, then ran the standard calibration offered by ScriptForPI.py in each project, splitting the calibrated data for J0217−0820. Within each project, the flux density was calibrated by the dedicated calibrator or scaled to the most recent online catalogue. Next, we self-calibrated the data in phase-only and in phase-and-amplitude mode to improve the fidelity of the image.
Blazars tend to be variable at submm wavelengths (e.g., Robson et al. 1983). To minimise the resulting effects, we used Common Astronomy Software Applications (CASA) tool, UVMODELFIT, to subtract the central calibrator from each independent observation before imaging, adopting a point source model.
After these steps, we combined the observations to create the final continuum image and datacube in each band, as follows. We used two imaging cycles to create the continuum images. We first made dirty images of all the observations using TCLEAN in ‘mfs’ mode, with zero clean iterations. Next, we rejected images with calibration issues and unsuccessful point-source subtraction, based on our visual inspection. Less than 2% of the total data were lost. After that, we used the CASA task, STATWT, to re-calculate the weights, based on the noise in each observation. Finally, TCLEAN constructed the combined image, wherein the AUTO-MULTITHRESH algorithm searched for robust emission during each major clean cycle. We also tapered the image to 0.4 and 0.8 arcsec spatial resolution (FWHM) to aid in the recovery of any extended sources. Our images of J0217−0820 are shown in Fig. 1.
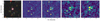 |
Fig. 1. Multi-wavelength images of J0217−0820. Left to right: RGB images from the DESI Legacy Imaging Surveys; ALMA images at 870 μm, 1.2 mm, 1.5 mm, and 2.0 mm. In the ALMA images, the central blazar has been removed; The orange ellipse shows the FWHM of the synthesized beam and the white contours show the emission 3σ above the rms noise. Except for the blazar, all the other sources are invisible in the optical image. |
We classified the continuum sources based on their multi-band colours (see Appendix A). Among the seven point-like sources, six have thermal spectra consistent with dusty starbursts, and one is a synchrotron source. Continuum images and measurements at different wavelengths are presented in Fig. 1 and Table 1. We name the seven sources as the Calabash brothers, or Huluwa, abbreviated to HLW1. There is also a radio jet associated with the central blazar, heading south-east.
To create the datacubes, we also followed two cycles. First, we used all the available data to create a dirty datacube in each ALMA band. After that, we extracted spectra at the positions of the seven continuum sources. Since the calibrator always shares the same instrumental configuration as the intended science target, the sensitivity can be quite different from observation to observation, resulting in quite different sensitivities at different frequencies. To make the best use of the spectral data, we normalised the extracted spectra by the sensitivities in each channel to create a ‘signal-to-noise (S/N) spectrum’ for each continuum source. These S/N spectra preserve strong spectral lines whilst suppressing large spikes caused by the low sensitivity at some frequencies. The resulting spectra are shown in Fig. 2.
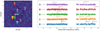 |
Fig. 2. Redshifts of the continuum sources in the J0217−0820 field. Left: continuum image at 870 μm. Right: confirmed spectral lines associated with those continuum sources in ALMA band 3 and band 4. A zoom version with the additional lines is available in Fig. B.1. We have confirmed five redshift groups. The central blazar lies at z = 0.6, while the surrounding dusty starbursts are located at four different redshifts. |
Starting with the 5σ peaks in our S/N spectra, we searched for additional lines, assuming the original peak to be 12CO or [C I]. After searching for all the possible emission lines, we returned to the original calibrated data and created a 1-GHz-wide datacube for each line. Similarly to the cleaning process for our continuum images, AUTO-MULTISHRESH was applied to identify channels with robust emission. We stopped cleaning when the peak emission fell below the 2σ noise level of the residual image.
3. Over-densities
We define the over-density of galaxies as follows:
where δgal is the galaxy over-density, ngal is the number of galaxies found in the field of interest and ⟨ngal⟩ is the average number of galaxies from the adopted reference survey.
Towards J0217−0820, we detected six DSFGs with S870 μm > 0.3 mJy, with three of them being classical SMGs with S870 μm > 3 mJy. Based on the number counts from large surveys at 870 μm (Chen et al. 2023, see also Stach et al. 2018; Béthermin et al. 2020; Simpson et al. 2020), the expected average number of DSFGs in the FoV of ALMA band 7 (d = 30″) is ⟨ngal⟩ ≈ 0.050 ± 0.002 at S870 μm > 3 mJy and ⟨ngal⟩ ≈ 0.67 ± 0.08 at S870 μm > 0.3 mJy. Then, the inferred over-density is δgal ≈ 59 and δgal ≈ 8.0, respectively. If we were to count the synchrotron source, the over-density would be even higher. Empirically, finding δgal ≳ 8 indicates strongly that a field is not consistent with the reference field, and likely contains a proto-cluster (e.g., Chiang et al. 2013; Lovell et al. 2018). Solely based on its over-density, J0217−0820 is thus an extremely promising proto-cluster candidate, similar to DRC (Lewis et al. 2018).
4. Redshift constraints
We identified 15 spectral lines in this field thanks to the wide spectral coverage of ALMACAL. We list all the confirmed spectral lines and their velocity-integrated flux densities in Table B.1.
The three brightest SMGs (HLW-1, HLW-2, HLW-3) have at least three spectral lines each, sufficient to tie down their redshifts unambiguously. HLW-4 displays no robust spectral lines. HLW-5 has only one robust spectral line, but it is at the same frequency as a line seen from its neighbour, HLW-2, so they are likely an interacting pair, as is common or possibly even ubiquitous amongst SMGs (Engel et al. 2010). HLW-6 has one strong spectral line (> 5σ) as well as a weak line at 92.8 GHz, consistent with CO(2–1) and (3–2) at z = 1.477. Even without the second, weaker line, it is clear that HLW-6 is not associated with any other galaxies in this field.
Considering its synchrotron spectrum, HLW-7 is likely at z = 0.6065 (as determined for the central blazar by the Sloan Digital Sky Survey – Albareti et al. 2017), that is, it may well be another jet hotspot or it can be a companion to the blazar, as they are close enough together to have possibly triggered each other’s AGN activity.
5. Discussion and conclusions
J0217−0820 was discovered within the 45-arcmin2 ALMACAL band 7 footprint, which is about 100 Mpc2 (comoving coordinates) at z ∼ 2. It is several orders of magnitude smaller than the parent surveys that led to the discoveries of the two extremes of confirmed proto-cluster cores (Oteo et al. 2018; Miller et al. 2018), because we started from data with a better spatial resolution by an order of magnitude. The negative K correction has greatly benefited the search for DSFGs across a wide redshift range, but because of this it also amplifies the projection effects (Hayward et al. 2013; Lovell et al. 2021). Clearly, given what we have found here, over-densities such as that around J0217−0820 could contaminate the search for genuine proto-cluster cores in future deep submm/mm sky surveys.
Strong lensing could amplify the flux density of the background sources and boost the number counts in the vicinity. Around the foreground blazar, we did not find other galaxies at the same redshift or share similar colours in the Dark Energy Spectroscopic Instrument (DESI) and VISTA/VIRCam images. It is therefore unlikely that this over-density is caused by the strong lensing of a foreground galaxy cluster. Meanwhile, the morphologies of the submm sources do not support the idea that they have been strongly lensed by the blazar.
We considered whether it was possible to find such alignments in cosmological simulations. To address the question, we made mock light cones based on recent simulations that predict submm/mm emission characteristics, then we searched those light cones for projected over-densities. We adopted the simulations from semi-analytical models (SAMs – Lagos et al. 2019, 2020), semi-empirical models (Béthermin et al. 2017; Popping et al. 2020), and hydro-dynamical simulations (Lovell et al. 2021). The results are presented in Fig. 3 and we offer more details in Appendix C.
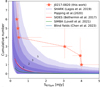 |
Fig. 3. Projected number of galaxies in various simulations. We search for galaxies following the same configuration of ALMA band 7 (d = 30″). We include the results from the lightcones of semi-empirical models (Béthermin et al. 2017; Popping et al. 2020), semi-analytic models (Lagos et al. 2019, 2020), and hydrodynamical simulations (Lovell et al. 2021). The shadows show the 1σ, 2σ, 3σ, and 5σ scatter in the lightcones of the SHARK simulation (Lagos et al. 2019). Error bars indicate the Poisson errors. Within the simulations it is very rare (> 5σ) to find the number of SMGs seen around J0217−0820, but the deeper the observation goes, the stronger the projection effect. |
We first note that almost all of the simulations predict much lower numbers of traditional, bright SMGs, with a significance higher than 5σ. This inconsistency could indicate that what we have found here is a real, rare alignment. However, the failure to reproduce the number density of SMGs has long been reported in the literature. Possible explanations are rooted in the stellar initial mass function (e.g., Baugh et al. 2005; Lacey et al. 2016), stellar and AGN feedback (Lovell et al. 2021; Hayward et al. 2021) as well as various dust-related models (including production, destruction and temperature; see a detailed discussion in Safarzadeh et al. 2017; Lagos et al. 2019; Lovell et al. 2021). Therefore, if such a chance alignment is much higher than what has been predicted, this discrepancy may also suggest that we could have under-predicted the cosmic variance of submm surveys.
At the fainter end, the probability of finding a similar overdensity is much higher than at the bright end. At S870 μm ∼ 0.1 mJy, the chance of finding more than six DSFGs is close to 5%. Considering the Poisson process on its own, the probability is only around 0.1%, which indicates that clustered structures in the Universe contribute to the projection effects. This effect should be strongest at submm/mm wavelengths, due to the large redshift space probed in the submm/mm windows. This cautions against the use of a simplistic statistical approach to select proto-clusters and quantify cosmic variance in deep submm surveys.
In summary, although J0217−0820 is an extremely over-dense region – where its over-density, δgal ≃ 8, is comparable to that of known extreme proto-cluster cores – we have determined that this is almost entirely due to chance alignments. In future deep galaxy surveys, for instance, those with ALMA in the submm/mm bands, similar projection effects may contaminate the search for proto-clusters and contribute to the cosmic variance.
There are seven Huluwa, each with different characteristics and abilities, see: https://en.wikipedia.org/wiki/Calabash_Brothers.
Acknowledgments
We are grateful for valuable feedback from an anonymous referee and inspiring discussions with Ian Smail, Gergö Popping and Roland Szakacs, all of which improved the manuscript. This work is funded by the Deutsche Forschungsgemeinschaft (DFG, German Research Foundation) under Germany’s Excellence Strategy – EXC-2094 – 390783311. This paper makes use of the ALMA data (see the full list in Appendix D). ALMA is a partnership of ESO (representing its member states), NSF (USA) and NINS (Japan), together with NRC (Canada), MOST and ASIAA (Taiwan), and KASI (Republic of Korea), in cooperation with the Republic of Chile. The Joint ALMA Observatory is operated by ESO, AUI/NRAO and NAOJ. All the data used in the work is publicly available from the ALMA science archive https://almascience.eso.org/alma-data.
References
- Albareti, F. D., Allende Prieto, C., Almeida, A., et al. 2017, ApJ, 233, 25 [NASA ADS] [Google Scholar]
- Alberts, S., & Noble, A. 2022, Universe, 8, 554 [Google Scholar]
- Barger, A. J., Cowie, L. L., Sanders, D. B., et al. 1998, Nature, 394, 248 [Google Scholar]
- Baugh, C. M., Lacey, C. G., Frenk, C. S., et al. 2005, MNRAS, 356, 1191 [Google Scholar]
- Behroozi, P., Wechsler, R. H., Hearin, A. P., & Conroy, C. 2019, MNRAS, 488, 3143 [NASA ADS] [CrossRef] [Google Scholar]
- Béthermin, M., Wu, H.-Y., Lagache, G., et al. 2017, A&A, 607, A89 [Google Scholar]
- Béthermin, M., Fudamoto, Y., Ginolfi, M., et al. 2020, A&A, 643, A2 [Google Scholar]
- Bond, J. R., Kofman, L., & Pogosyan, D. 1996, Nature, 380, 603 [NASA ADS] [CrossRef] [Google Scholar]
- Calvi, R., Castignani, G., & Dannerbauer, H. 2023, A&A, submitted [arXiv.2302.10323] [Google Scholar]
- Capak, P. L., Riechers, D., Scoville, N. Z., et al. 2011, Nature, 470, 233 [Google Scholar]
- Chapman, S. C., Bertoldi, F., Smail, I., et al. 2015, MNRAS, 453, 951 [NASA ADS] [CrossRef] [Google Scholar]
- Chen, J., Ivison, R. J., Zwaan, M. A., et al. 2023, MNRAS, 518, 1378 [Google Scholar]
- Chiang, Y.-K., Overzier, R., & Gebhardt, K. 2013, ApJ, 779, 127 [Google Scholar]
- Dannerbauer, H., Kurk, J. D., De Breuck, C., et al. 2014, A&A, 570, A55 [NASA ADS] [CrossRef] [EDP Sciences] [Google Scholar]
- Davé, R., Anglés-Alcázar, D., Narayanan, D., et al. 2019, MNRAS, 486, 2827 [Google Scholar]
- Dekel, A., Sari, R., & Ceverino, D. 2009, AJ, 703, 785 [NASA ADS] [CrossRef] [Google Scholar]
- Engel, H., Tacconi, L. J., Davies, R. I., et al. 2010, ApJ, 724, 233 [NASA ADS] [CrossRef] [Google Scholar]
- Hatch, N. A., Kurk, J. D., Pentericci, L., et al. 2011, MNRAS, 415, 2993 [NASA ADS] [CrossRef] [Google Scholar]
- Hayashi, M., Kodama, T., Tadaki, K.-I., Koyama, Y., & Tanaka, I. 2012, ApJ, 757, 15 [NASA ADS] [CrossRef] [Google Scholar]
- Hayward, C. C., Behroozi, P. S., Somerville, R. S., et al. 2013, MNRAS, 434, 2572 [NASA ADS] [CrossRef] [Google Scholar]
- Hayward, C. C., Sparre, M., Chapman, S. C., et al. 2021, MNRAS, 502, 2922 [Google Scholar]
- Helton, J. M., Sun, F., Woodrum, C., et al. 2023, ApJ, submitted [Google Scholar]
- Hodge, J. A., & da Cunha, E. 2020, R. Soc. Open Sci., 7, 200556 [NASA ADS] [CrossRef] [Google Scholar]
- Hughes, D. H., Serjeant, S., Dunlop, J., et al. 1998, Nature, 394, 241 [Google Scholar]
- Ivison, R. J., Lewis, A. J. R., Weiss, A., et al. 2016, ApJ, 832, 78 [Google Scholar]
- Ivison, R. J., Biggs, A. D., Bremer, M., Arumugam, V., & Dunne, L. 2020, MNRAS, 496, 4358 [NASA ADS] [CrossRef] [Google Scholar]
- Jin, S., Sillassen, N. B., Magdis, G. E., et al. 2023, A&A, 670, L11 [NASA ADS] [CrossRef] [EDP Sciences] [Google Scholar]
- Klitsch, A., Péroux, C., Zwaan, M. A., et al. 2019, MNRAS, 490, 1220 [NASA ADS] [CrossRef] [Google Scholar]
- Kurk, J. D., Röttgering, H. J. A., Pentericci, L., et al. 2000, A&A, 358, L1 [NASA ADS] [Google Scholar]
- Kurk, J. D., Pentericci, L., Overzier, R. A., Röttgering, H. J. A., & Miley, G. K. 2004, A&A, 428, 817 [NASA ADS] [CrossRef] [EDP Sciences] [Google Scholar]
- Lacey, C. G., Baugh, C. M., Frenk, C. S., et al. 2016, MNRAS, 462, 3854 [Google Scholar]
- Lagos, C. D. P., Robotham, A. S. G., Trayford, J. W., et al. 2019, MNRAS, 489, 4196 [NASA ADS] [CrossRef] [Google Scholar]
- Lagos, C. D. P., da Cunha, E., Robotham, A. S. G., et al. 2020, MNRAS, 499, 1948 [CrossRef] [Google Scholar]
- Lammers, C., Hill, R., Lim, S., et al. 2022, MNRAS, 514, 5004 [NASA ADS] [CrossRef] [Google Scholar]
- Laporte, N., Zitrin, A., Dole, H., et al. 2022, A&A, 667, L3 [NASA ADS] [CrossRef] [EDP Sciences] [Google Scholar]
- Lewis, A. J. R., Ivison, R. J., Best, P. N., et al. 2018, ApJ, 862, 96 [NASA ADS] [CrossRef] [Google Scholar]
- Li, Q., Wang, R., Fan, X., et al. 2020, ApJ, 900, 12 [NASA ADS] [CrossRef] [Google Scholar]
- Li, Q., Wang, R., Fan, X., et al. 2023, ApJ, accepted [Google Scholar]
- Lilly, S. J., Eales, S. A., Gear, W. K. P., et al. 1999, ApJ, 518, 641 [Google Scholar]
- Lovell, C. C., Thomas, P. A., & Wilkins, S. M. 2018, MNRAS, 474, 4612 [NASA ADS] [CrossRef] [Google Scholar]
- Lovell, C. C., Geach, J. E., Davé, R., Narayanan, D., & Li, Q. 2021, MNRAS, 502, 772 [NASA ADS] [CrossRef] [Google Scholar]
- MacKenzie, T. P., Scott, D., Bianconi, M., et al. 2017, MNRAS, 468, 4006 [NASA ADS] [CrossRef] [Google Scholar]
- Matsuda, Y., Yamada, T., Hayashino, T., et al. 2004, AJ, 128, 569 [NASA ADS] [CrossRef] [Google Scholar]
- Meyer, R. A., Decarli, R., Walter, F., et al. 2022, ApJ, 927, 141 [NASA ADS] [CrossRef] [Google Scholar]
- Miley, G., & De Breuck, C. 2008, A&ARv, 15, 67 [Google Scholar]
- Miller, T. B., Chapman, S. C., Aravena, M., et al. 2018, Nature, 556, 469 [CrossRef] [Google Scholar]
- Morishita, T., Roberts-Borsani, G., Treu, T., et al. 2023, ApJ, 947, L24 [NASA ADS] [CrossRef] [Google Scholar]
- Nowotka, M., Chen, C.-C., Battaia, F. A., et al. 2022, A&A, 658, A77 [NASA ADS] [CrossRef] [EDP Sciences] [Google Scholar]
- Oteo, I., Zwaan, M. A., Ivison, R. J., Smail, I., & Biggs, A. D. 2016, ApJ, 822, 36 [NASA ADS] [CrossRef] [Google Scholar]
- Oteo, I., Zwaan, M. A., Ivison, R. J., Smail, I., & Biggs, A. D. 2017, ApJ, 837, 182 [Google Scholar]
- Oteo, I., Ivison, R. J., Dunne, L., et al. 2018, ApJ, 856, 72 [Google Scholar]
- Ouchi, M., Shimasaku, K., Akiyama, M., et al. 2005, ApJ, 620, L1 [NASA ADS] [CrossRef] [Google Scholar]
- Overzier, R. A. 2016, A&ARv, 24, 14 [Google Scholar]
- Overzier, R. A., Nesvadba, N. P. H., Dijkstra, M., et al. 2013, ApJ, 771, 89 [NASA ADS] [CrossRef] [Google Scholar]
- Pentericci, L., Kurk, J. D., Carilli, C. L., et al. 2002, A&A, 396, 109 [NASA ADS] [CrossRef] [EDP Sciences] [Google Scholar]
- Popping, G., Walter, F., Behroozi, P., et al. 2020, ApJ, 891, 135 [NASA ADS] [CrossRef] [Google Scholar]
- Robson, E. I., Gear, W. K., Clegg, P. E., et al. 1983, Nature, 305, 194 [NASA ADS] [CrossRef] [Google Scholar]
- Robson, E. I., Ivison, R. J., Smail, I., et al. 2014, ApJ, 793, 11 [NASA ADS] [CrossRef] [Google Scholar]
- Safarzadeh, M., Lu, Y., & Hayward, C. C. 2017, MNRAS, 472, 2462 [NASA ADS] [CrossRef] [Google Scholar]
- Seymour, N., Stern, D., De Breuck, C., et al. 2007, ApJS, 171, 353 [CrossRef] [Google Scholar]
- Simpson, J. M., Smail, I., Dudzevičiūtė, U., et al. 2020, MNRAS, 495, 3409 [Google Scholar]
- Smail, I., Ivison, R. J., & Blain, A. W. 1997, ApJ, 490, L5 [NASA ADS] [CrossRef] [Google Scholar]
- Stach, S. M., Smail, I., Swinbank, A. M., et al. 2018, ApJ, 860, 161 [Google Scholar]
- Steidel, C. C., Adelberger, K. L., Dickinson, M., et al. 1998, ApJ, 492, 428 [Google Scholar]
- Steidel, C. C., Adelberger, K. L., Shapley, A. E., et al. 2000, ApJ, 532, 170 [NASA ADS] [CrossRef] [Google Scholar]
- Stevens, J. A., Ivison, R. J., Dunlop, J. S., et al. 2003, Nature, 425, 264 [NASA ADS] [CrossRef] [Google Scholar]
- Swinbank, A. M., Chapman, S. C., Smail, I., et al. 2006, MNRAS, 371, 465 [NASA ADS] [CrossRef] [Google Scholar]
- Tanaka, I., De Breuck, C., Kurk, J. D., et al. 2011, PASJ, 63, S415 [NASA ADS] [CrossRef] [Google Scholar]
- Umehata, H., Hatsukade, B., Smail, I., et al. 2018, PASJ, 70, 65 [Google Scholar]
- Umehata, H., Fumagalli, M., Smail, I., et al. 2019, Science, 366, 97 [Google Scholar]
- Wang, G. C. P., Hill, R., Chapman, S. C., et al. 2021, MNRAS, 508, 3754 [NASA ADS] [CrossRef] [Google Scholar]
- Wylezalek, D., Galametz, A., Stern, D., et al. 2013a, ApJ, 769, 79 [NASA ADS] [CrossRef] [Google Scholar]
- Wylezalek, D., Vernet, J., De Breuck, C., et al. 2013b, MNRAS, 428, 3206 [CrossRef] [Google Scholar]
- Zeballos, M., Aretxaga, I., Hughes, D. H., et al. 2018, MNRAS, 479, 4577 [Google Scholar]
- Zhang, Y., Zheng, X. Z., Shi, D. D., et al. 2022, MNRAS, 512, 4893 [NASA ADS] [CrossRef] [Google Scholar]
- Zirm, A. W., Stanford, S. A., Postman, M., et al. 2008, ApJ, 680, 224 [NASA ADS] [CrossRef] [Google Scholar]
- Zwaan, M., Ivison, R., Peroux, C., et al. 2022, Messenger, 10–13, 4 [Google Scholar]
Appendix A: Source classification
We classified the sources based on multi-band photometry from ALMA. For thermal emission from dust, the submm/mm flux densities of DSFGs decrease with increasing wavelength; on the other hand, for synchrotron emission, their flux densities will increase. These emission mechanisms can therefore be aptly separated by their submm/mm colours. We constructed a colour-colour plot based on ALMA bands 4, 6, and 7 for all the sources in Fig. A.1. The three bright SMGs share a similar spectral index in the ALMA bands, which is different from the radio sources, including the blazar and jet. The other three DSFGs are only detected in bands 6 and 7, so we used their upper limits in band 4 to calculate the colours. Although they suffer from large uncertainties, their submm colours are close to those of the SMGs. In band 3, we did not detect the continuum emission of the DSFGs; also, the central band-3 region is contaminated by the blazar. For these reasons, we did not include the band-3 continuum measurements in Table. 1.
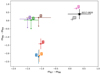 |
Fig. A.1. Submm/mm colours of the detected sources. The colours of the synchrotron radio sources are quite distinct from those of the DSFGs. |
Appendix B: Spectral lines
We measured the line fluxes of all the detected emission lines in Fig. B.1. We extracted the spectra using a fixed aperture, twice the size of the synthesised beam. Since most of the sources remain unresolved or only marginally resolved in our images, this aperture gives the most robust results based on our tests. All the emission lines detected in bands 3 and 4 have negligible continuum emission, so we fitted the extracted spectra with a single Gaussian line profile. For the lines detected in bands 5 and 6, we fitted the line with a Gaussian profile plus a flat continuum. The resulting line fluxes are reported in Table B.1.
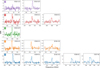 |
Fig. B.1. Zoomed-in view of the spectral lines in Fig. 2, with additional lines found in ALMA band 5 and band 6. |
Measured flux of the confirmed spectral lines.
Appendix C: Simulations
Recently, numerical simulations have successfully reproduced the number counts of DSFGs over a wide range of flux densities (Chen et al. 2023). These simulations can thus be used to test the projection effect with various setups. Depending on the adopted methodologies, different works have used different assumptions and approximations. It is therefore worth carrying out these tests in the context of different types of simulations.
We adopted the semi-analytical simulation from the SHARK project (Lagos et al. 2019, 2020), which has a cubic volume of (210 cMpc h−1)3, and calculated the dust emission from the SED template PROSPECT2. We also adopted the semi-empirical simulation from Popping et al. (2020), which plugged the observational scaling relations into UNIVEREMACHINE (Behroozi et al. 2019) and produced a simulated cubic Universe with a volume of (250 cMpc h−1)3. The submm/mm flux densities of the galaxies are scaled from their SFR and dust mass (Popping et al. 2020). For the hydrodynamical simulations, we used the light cones from Lovell et al. (2021), which performed full radiative transfer simulations for all the galaxies with SFR> 20 M ⊙ yr−1 in the SIMBA (100 cMpc h−1)3 box (Davé et al. 2019). This simulation is only complete for DSFGs with S850 > 0.25 mJy, similarly to the case of the faintest DSFGs found around J0217−0820.
With all these simulated light cones, we searched for DSFGs following the same observational setups. We used the same FoV as we did in band 7 (d = 30″). We randomly placed the pointing within the simulated light cone and then counted the number of DSFGs as a function of flux density in each pointing. We repeated this process 1000 times to obtain the average number of DSFGs at each flux level and to sample their variations. We note that the simulations did not all model the radio emission of the galaxies, so we can only compare the results for DSFGs. We did not apply redshift constraints when searching for over-densities in the simulated light cones, as the dominant population of DSFGs lies at z > 1 (Lagos et al. 2019; Popping et al. 2020).
Appendix D: ALMA projects
2015.1.00456.S, 2015.1.00862.S, 2015.1.00820.S, 2016.1.00282.S, 2016.1.00434.S, 2016.1.00754.S, 2016.1.01184.S, 2016.1.01172.S, 2016.1.01262.S, 2017.1.00413.S, 2017.1.00562.S, 2017.1.01027.S, 2017.1.01492.S, 2017.1.01674.S, 2018.1.00164.S, 2018.1.00478.S, 2018.1.00490.S, 2018.1.00657.S, 2018.1.00815.S, 2018.1.00828.S, 2018.1.00922.S, 2018.1.00966.S, 2018.1.01044.S, 2018.1.01140.S, 2018.1.01188.S, 2019.1.00074.S, 2019.1.00102.S, 2019.1.00337.S, 2019.1.00363.S, 2019.1.00397.S, 2019.1.00900.S, 2019.1.01027.S, 2019.1.01329.S, 2019.1.01529.S, 2019.1.01634.L, 2021.1.00207.S, 2021.1.00666.S, 2021.1.00705.S, 2021.1.01342.S, 2021.1.01535.S, 2021.1.01650.S, 2021.1.01683.S,
All Tables
All Figures
|
Fig. 1. Multi-wavelength images of J0217−0820. Left to right: RGB images from the DESI Legacy Imaging Surveys; ALMA images at 870 μm, 1.2 mm, 1.5 mm, and 2.0 mm. In the ALMA images, the central blazar has been removed; The orange ellipse shows the FWHM of the synthesized beam and the white contours show the emission 3σ above the rms noise. Except for the blazar, all the other sources are invisible in the optical image. |
| In the text | |
|
Fig. 2. Redshifts of the continuum sources in the J0217−0820 field. Left: continuum image at 870 μm. Right: confirmed spectral lines associated with those continuum sources in ALMA band 3 and band 4. A zoom version with the additional lines is available in Fig. B.1. We have confirmed five redshift groups. The central blazar lies at z = 0.6, while the surrounding dusty starbursts are located at four different redshifts. |
| In the text | |
|
Fig. 3. Projected number of galaxies in various simulations. We search for galaxies following the same configuration of ALMA band 7 (d = 30″). We include the results from the lightcones of semi-empirical models (Béthermin et al. 2017; Popping et al. 2020), semi-analytic models (Lagos et al. 2019, 2020), and hydrodynamical simulations (Lovell et al. 2021). The shadows show the 1σ, 2σ, 3σ, and 5σ scatter in the lightcones of the SHARK simulation (Lagos et al. 2019). Error bars indicate the Poisson errors. Within the simulations it is very rare (> 5σ) to find the number of SMGs seen around J0217−0820, but the deeper the observation goes, the stronger the projection effect. |
| In the text | |
|
Fig. A.1. Submm/mm colours of the detected sources. The colours of the synchrotron radio sources are quite distinct from those of the DSFGs. |
| In the text | |
|
Fig. B.1. Zoomed-in view of the spectral lines in Fig. 2, with additional lines found in ALMA band 5 and band 6. |
| In the text | |
Current usage metrics show cumulative count of Article Views (full-text article views including HTML views, PDF and ePub downloads, according to the available data) and Abstracts Views on Vision4Press platform.
Data correspond to usage on the plateform after 2015. The current usage metrics is available 48-96 hours after online publication and is updated daily on week days.
Initial download of the metrics may take a while.