Fig. 7.
Download original image
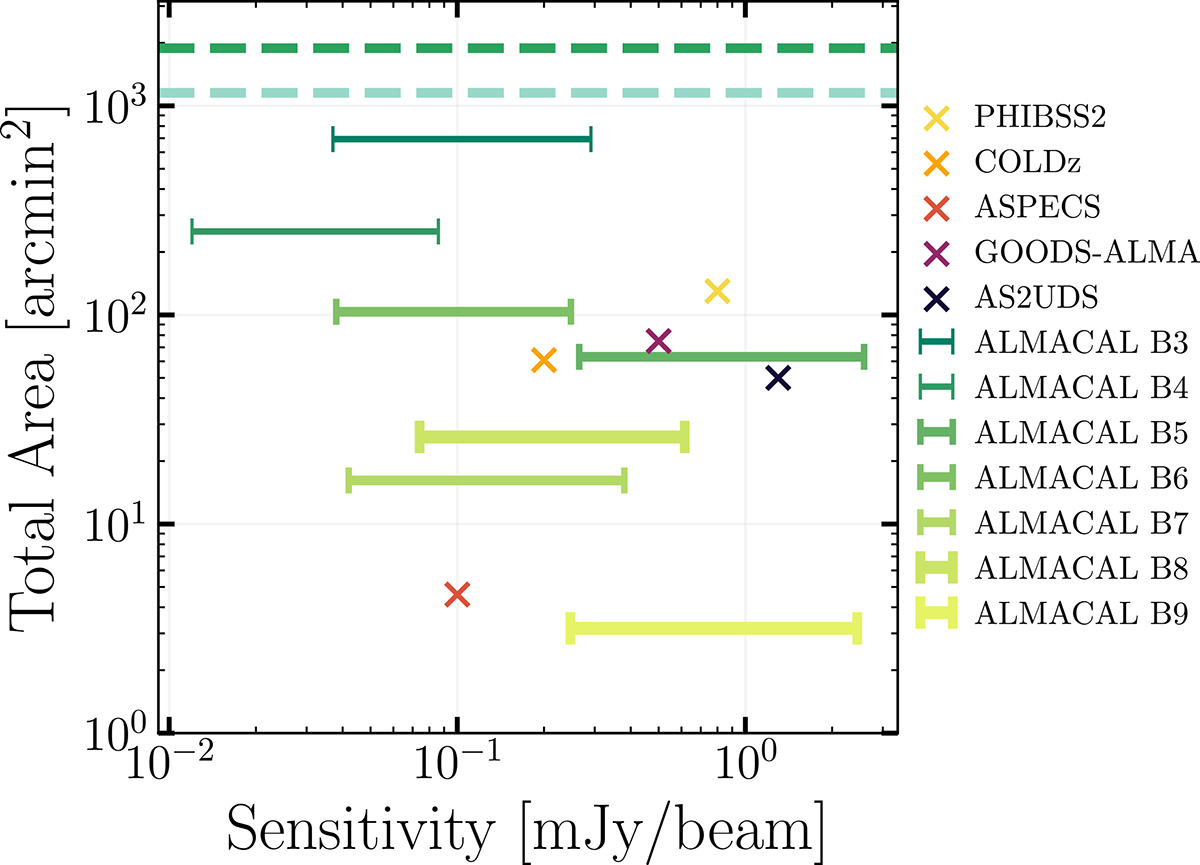
Total ALMACAL survey area vs the median sensitivity range reached in each band for the pruned sample. For comparison, we plot the area and sensitivity values from the previous surveys, PHIBSS2 (Lenkić et al. 2020), COLDz (Riechers et al. 2019), ASPECS (Decarli et al. 2016) in ALMA Bands 3 and 6, GOODS-ALMA (Gómez-Guijarro et al. 2022) in ALMA Band 6, and AS2UDS (Stach et al. 2019) in ALMA Band 7. The dashed light and dark lines show the total area accumulated by summing up all the bands for the pruned sample and the full sample. The total survey area counts every calibration field once, considering the largest area.
Current usage metrics show cumulative count of Article Views (full-text article views including HTML views, PDF and ePub downloads, according to the available data) and Abstracts Views on Vision4Press platform.
Data correspond to usage on the plateform after 2015. The current usage metrics is available 48-96 hours after online publication and is updated daily on week days.
Initial download of the metrics may take a while.