Fig. 5.
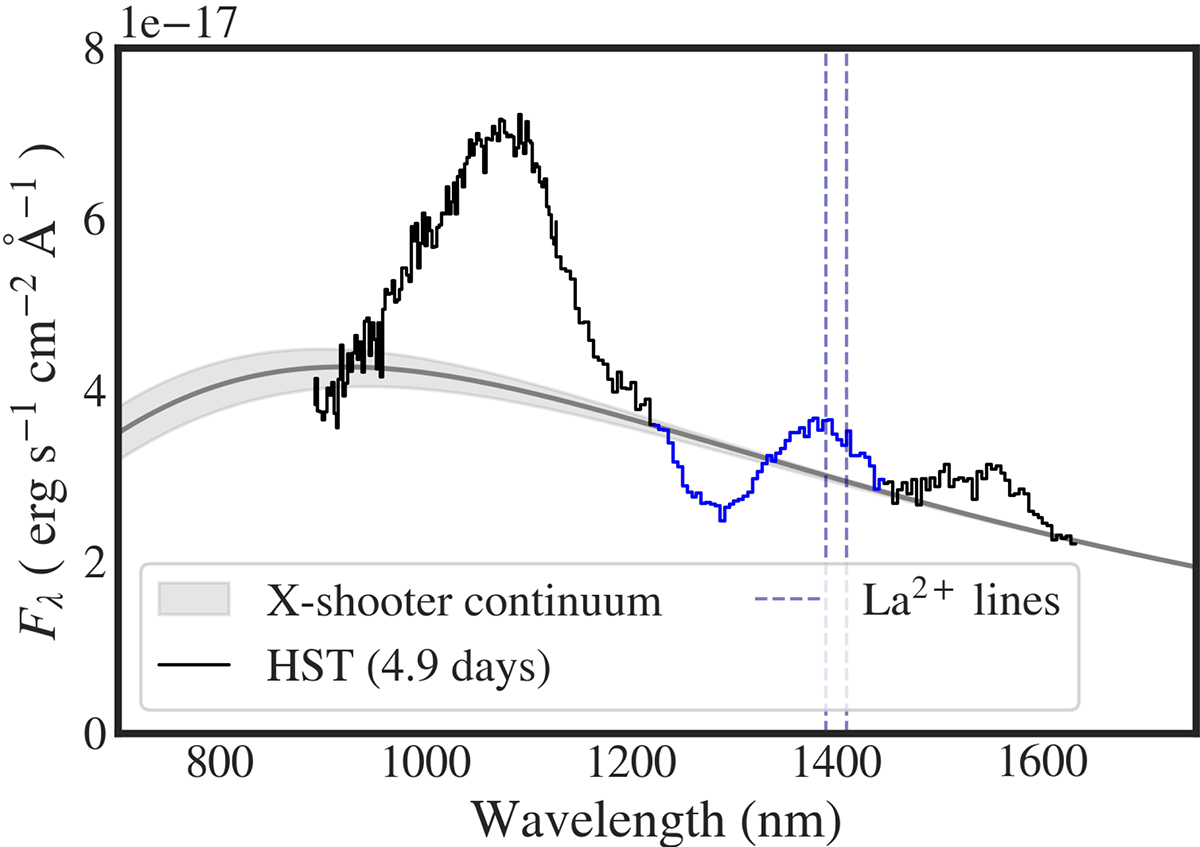
Download original image
HST spectrum of AT2017gfo at 4.9 days post-merger from Tanvir et al. (2017). The grey shaded region indicates the continuum constraints from the interpolation of the X-shooter spectra taken at 4.4 and 5.4 days post-merger. Regardless of the exact continuum modelling, a P Cygni absorption/emission feature around 1400 nm is clearly visible. Domoto et al. (2022) suggested that this feature could be due to La III lines (here indicated with dashed blue lines). The characteristic velocity of this feature is relatively low, vph = 0.07 ± 0.01c, but may be systematically biased by the strong nearby features (including the prominent reverberation emission peak around 1.1 μm).
Current usage metrics show cumulative count of Article Views (full-text article views including HTML views, PDF and ePub downloads, according to the available data) and Abstracts Views on Vision4Press platform.
Data correspond to usage on the plateform after 2015. The current usage metrics is available 48-96 hours after online publication and is updated daily on week days.
Initial download of the metrics may take a while.