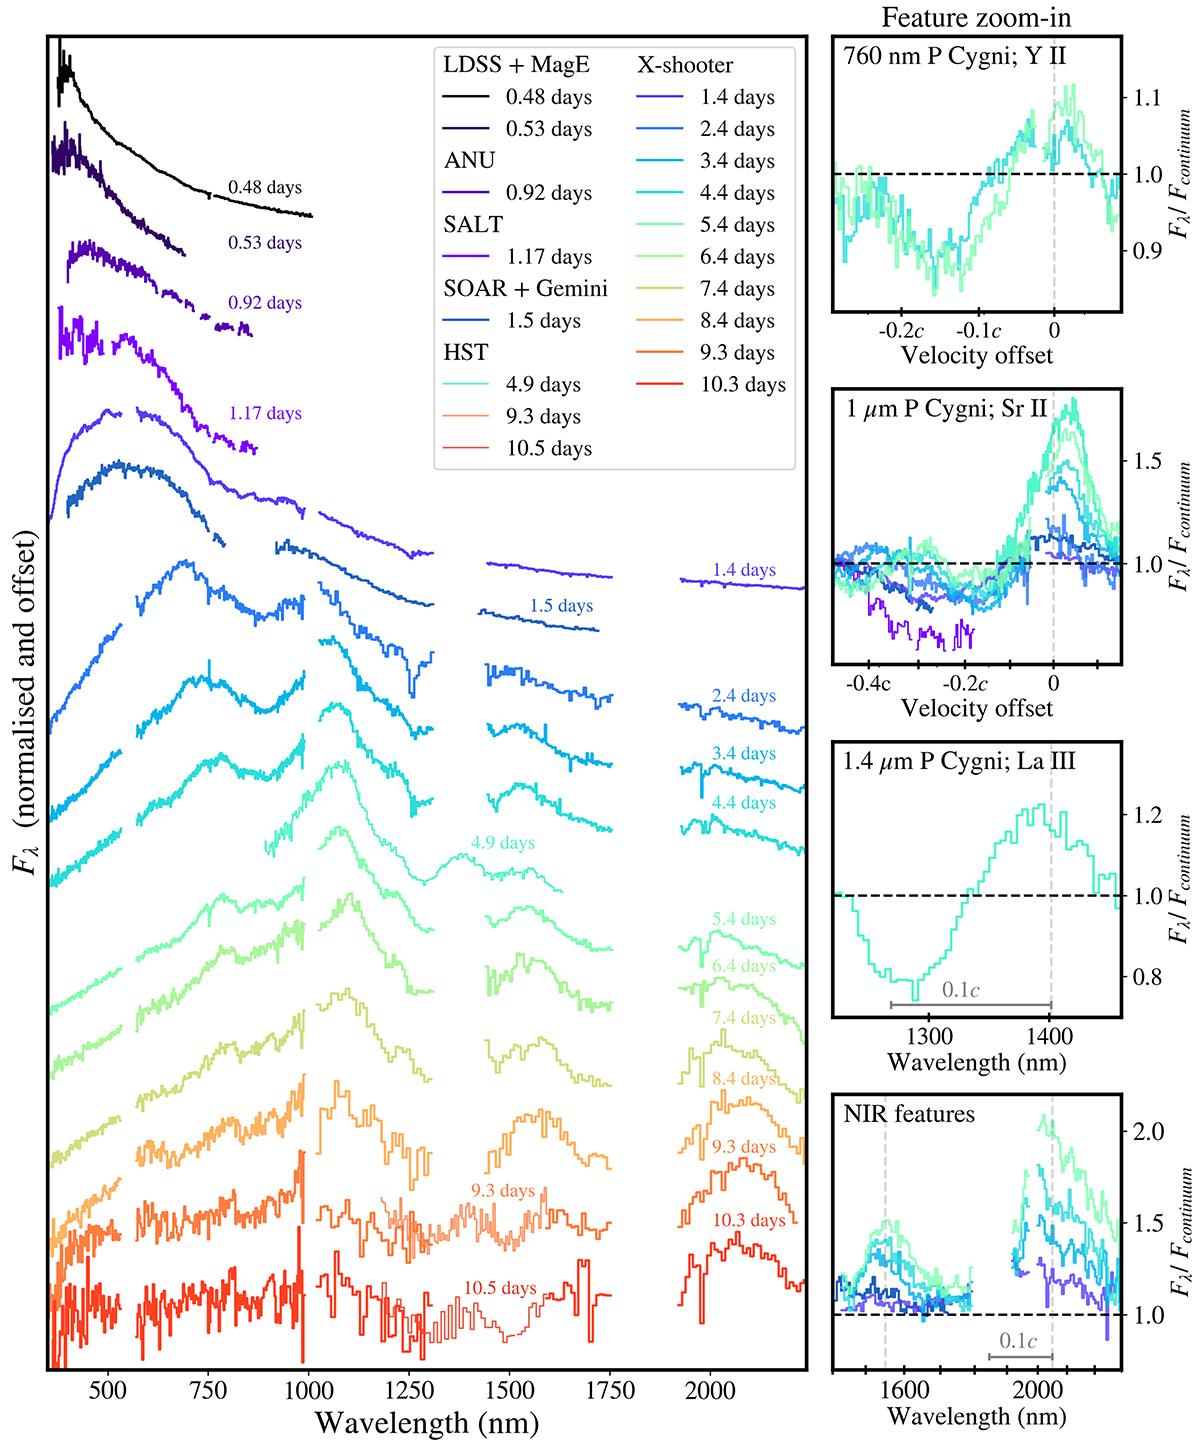
Fig. 1.
Download original image
Spectral series of the kilonova AT2017gfo showing the evolution over the first 10 days post-merger. This spectral compilation of data includes the early spectra taken with the Magellan telescopes (Shappee et al. 2017), ANU 2.3 m telescope (Andreoni et al. 2017) and SALT (Buckley et al. 2018). From 1.4 days post-merger, the X-shooter spectrograph at the European Southern Observatory’s VLT detailed the UV to NIR structure with a daily cadence (Pian et al. 2017; Smartt et al. 2017). To constrain the rapid evolution at early times, we also include the 1.5 day Gemini FLAMINGOS-2 and SOAR spectra (Nicholl et al. 2017; Chornock et al. 2017). Towards intermediate and late-times, HST (Tanvir et al. 2017) infrared spectroscopy additionally constrains the spectral structure in the telluric region around 1400 nm. The spectral continuum is well described as a blackbody in all photospheric epochs and even into nebular-phase epochs with a blackbody temperature evolution that is detailed in Sect. 4. In the zoom-in sub-panels, individual spectral lines are highlighted at different epochs, including (1) the 760 nm (2) 1.0 μm, and (3) 1.4 μm P Cygni features, and (4) the NIR line-emission features.
Current usage metrics show cumulative count of Article Views (full-text article views including HTML views, PDF and ePub downloads, according to the available data) and Abstracts Views on Vision4Press platform.
Data correspond to usage on the plateform after 2015. The current usage metrics is available 48-96 hours after online publication and is updated daily on week days.
Initial download of the metrics may take a while.