Fig. 4.
Download original image
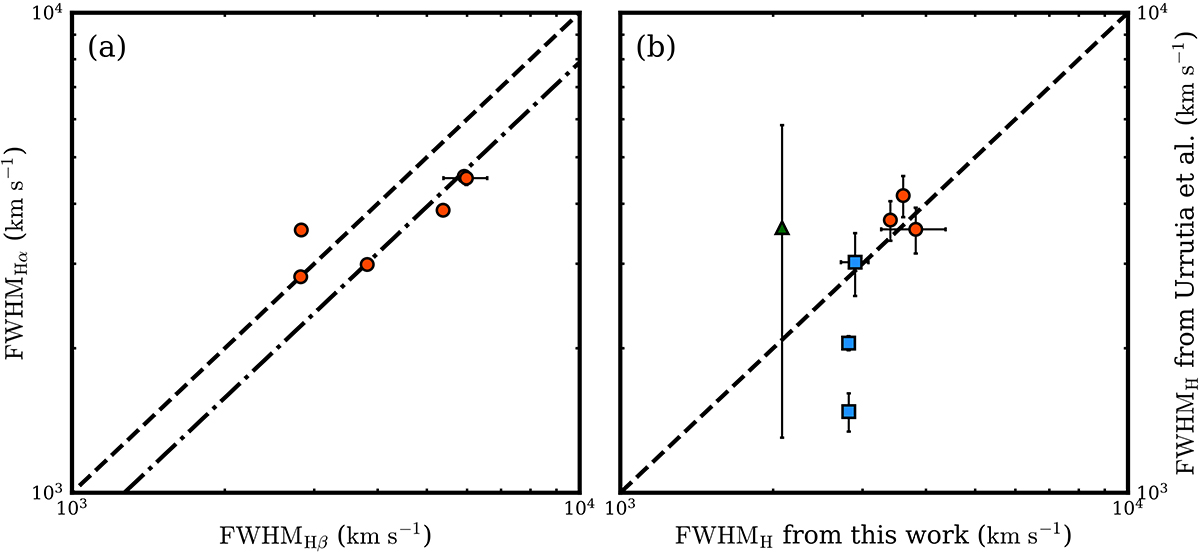
(a) Comparison of FWHM values of broad components of Hβ and Hα lines. The dashed line denotes a line where the FWHM values of the Balmer lines are identical, and dash-dotted line is a well-known relationship between the FWHM values of the Balmer lines (Bisogni et al. 2017). (b) Comparison of Balmer line FWHM values measured from this work and Urrutia et al. (2012). Red circles denote the comparison of FWHMHβ measurements, and blue squares mean the comparison of FWHMHα measurements. Green triangles represent the FWHMHα measurement comparison, but the FWHMHβ measured in Urrutia et al. (2012) was converted to FWHMHα using the relationship established in Bisogni et al. (2017). The meaning of the dashed line is identical to that of panel (a).
Current usage metrics show cumulative count of Article Views (full-text article views including HTML views, PDF and ePub downloads, according to the available data) and Abstracts Views on Vision4Press platform.
Data correspond to usage on the plateform after 2015. The current usage metrics is available 48-96 hours after online publication and is updated daily on week days.
Initial download of the metrics may take a while.