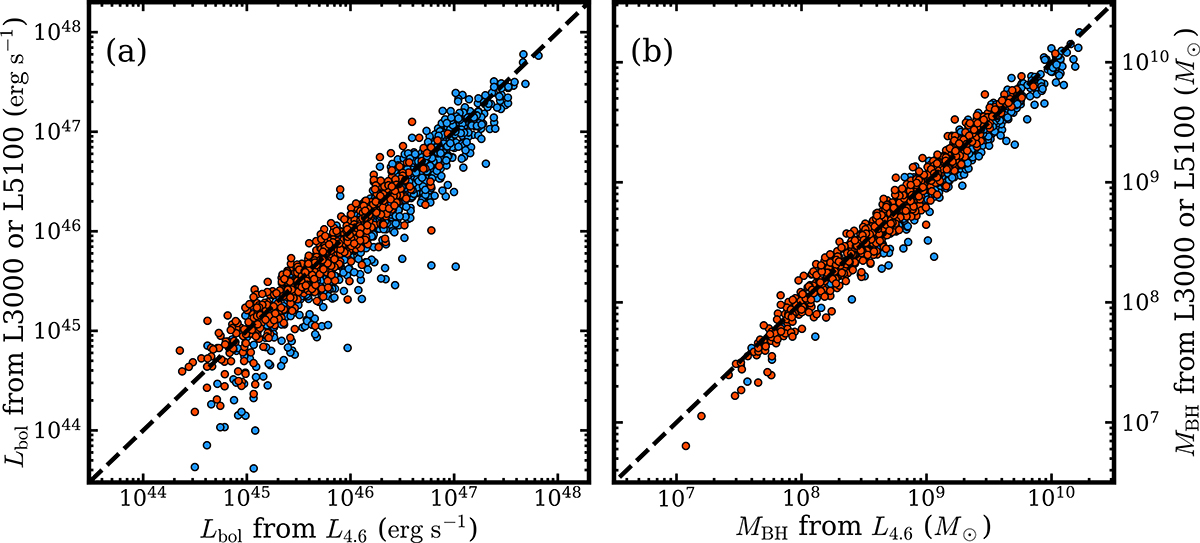
Fig. 12.
Download original image
(a) Comparison of Lbol values from L4.6 and those obtained using different estimators. Red circles mean the Lbol values derived from L5100, while blue circles denote those derived from L3000. The dashed line is a line for which the Lbol values are identical. (b) MBH values measured based on L4.6 versus those from different methods. Red circles represent the comparison of MBH values measured using L4.6 and FWHMH, compared to those derived from L5100 and FWHMH. Meanwhile, blue circles denote the MBH values derived using L4.6 and FWHMMg II, versus those from L3000 and FWHMMg II. The dashed line denotes a line for which the MBH values are identical.
Current usage metrics show cumulative count of Article Views (full-text article views including HTML views, PDF and ePub downloads, according to the available data) and Abstracts Views on Vision4Press platform.
Data correspond to usage on the plateform after 2015. The current usage metrics is available 48-96 hours after online publication and is updated daily on week days.
Initial download of the metrics may take a while.