Fig. 11.
Download original image
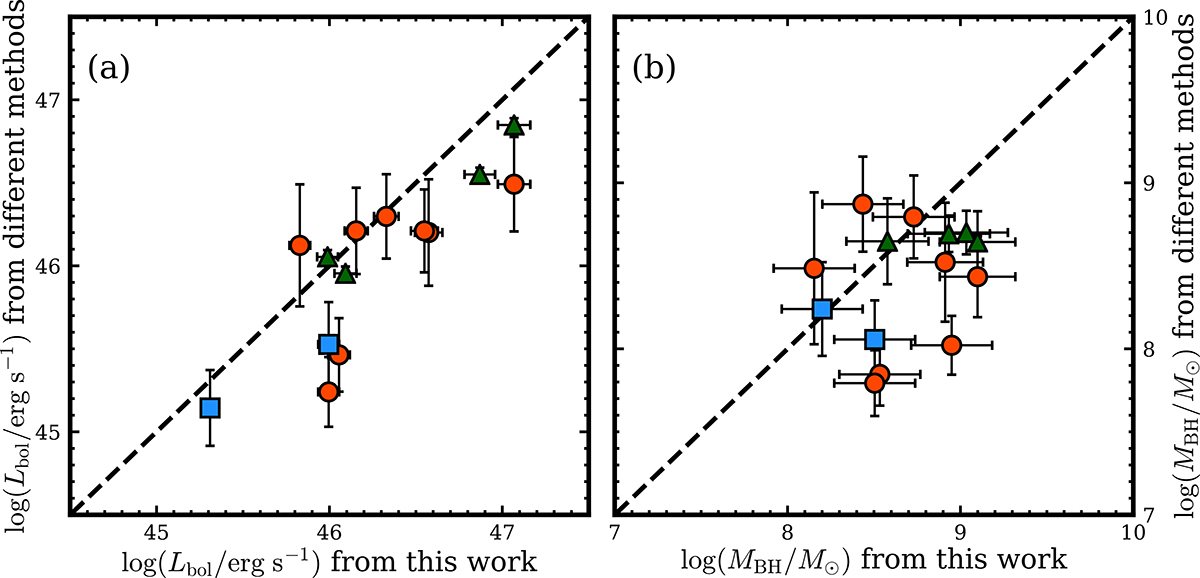
(a) Comparison of Lbol values from this work and different estimators. Red circles, blue squares, and green triangles denote the Lbol values derived by using Pβ, Pα, and L15, respectively. The dashed line denotes a line where the Lbol values are identical. (b) MBH values from this work versus those from different methods. Red circles and blue squares represent the MBH values measured with Pβ and Pα lines, respectively. Green triangles denote the MBH values estimated from L15 and the Balmer line width. The dashed line represents a line for which the MBH values are identical.
Current usage metrics show cumulative count of Article Views (full-text article views including HTML views, PDF and ePub downloads, according to the available data) and Abstracts Views on Vision4Press platform.
Data correspond to usage on the plateform after 2015. The current usage metrics is available 48-96 hours after online publication and is updated daily on week days.
Initial download of the metrics may take a while.