Open Access
Fig. 9.
Download original image
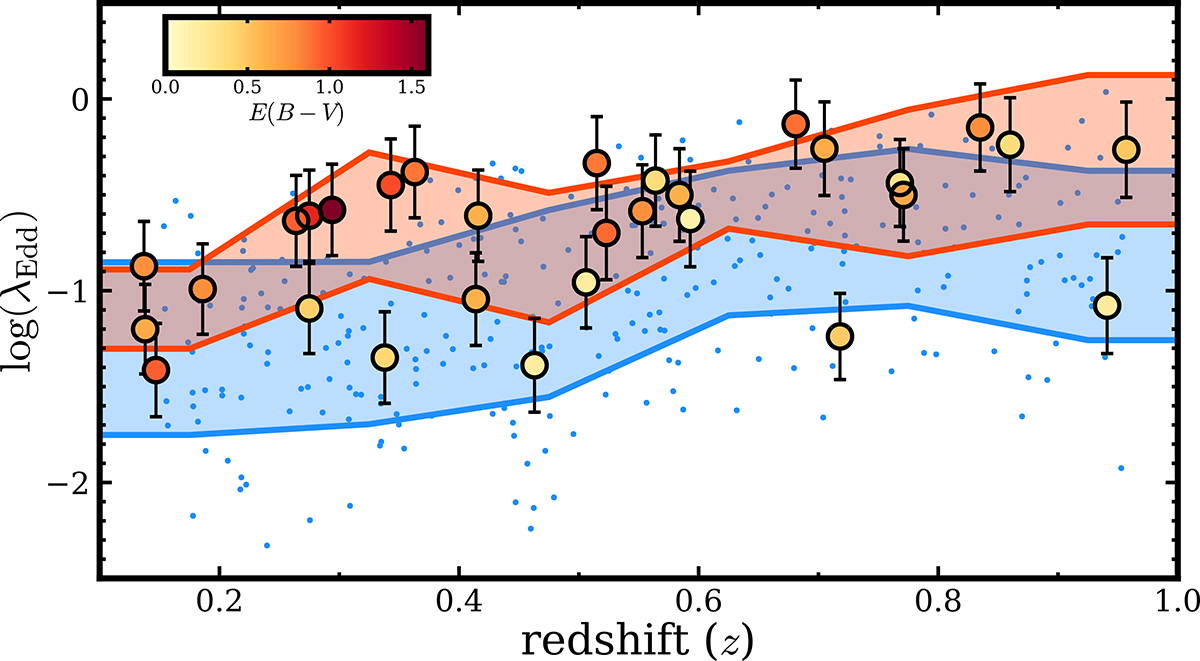
log λEdd values vs. redshifts. The meanings of open circles and blue dots are identical to Fig. 7. Red and blue polygons represent the log λEdd values and their standard deviations of dust-obscured and unobscured quasars, respectively, which are divided into six subsamples by redshifts.
Current usage metrics show cumulative count of Article Views (full-text article views including HTML views, PDF and ePub downloads, according to the available data) and Abstracts Views on Vision4Press platform.
Data correspond to usage on the plateform after 2015. The current usage metrics is available 48-96 hours after online publication and is updated daily on week days.
Initial download of the metrics may take a while.