Open Access
Fig. 8
Download original image
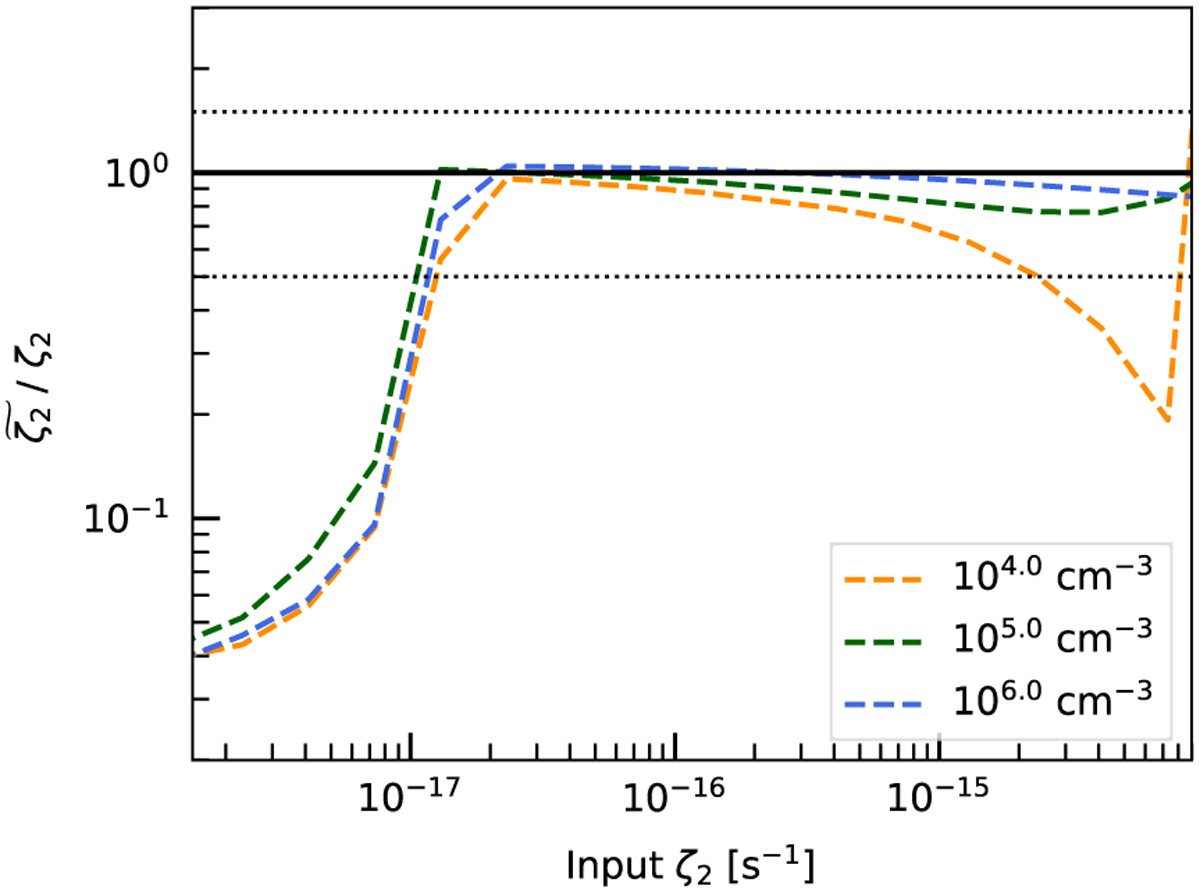
Comparison of ![]() as a function of the input ζ2 in the HMC models. Orange, green, and blue lines represent results at nH = 104, 105, 106 cm−3. Dashed horizontal lines represent the 50% deviation from the input values.
as a function of the input ζ2 in the HMC models. Orange, green, and blue lines represent results at nH = 104, 105, 106 cm−3. Dashed horizontal lines represent the 50% deviation from the input values.
Current usage metrics show cumulative count of Article Views (full-text article views including HTML views, PDF and ePub downloads, according to the available data) and Abstracts Views on Vision4Press platform.
Data correspond to usage on the plateform after 2015. The current usage metrics is available 48-96 hours after online publication and is updated daily on week days.
Initial download of the metrics may take a while.