Fig. 4
Download original image
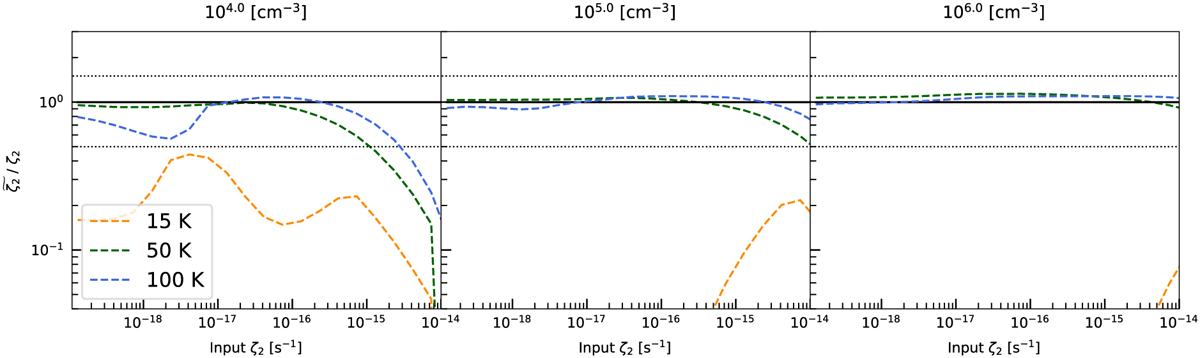
Comparison between our approach and the UCLCHEM simulations. The x-axis denotes the input CRIR of each simulation, where the CRIR in each simulation is treated as uniform. The y-axis denotes the ratio between the calculated CRIR and the input one (![]() ) at t = 106 yr. The black horizontal line represents the fiducial value and the horizontal dotted lines represent 50% of the deviation from the input values. Orange, green, and blue dashed lines represent results at Tk = 15, 50, and 100 K. Columns from left to right represent simulations with the cloud densities nH = 104, 105, and 106 cm−3. The large deviation at 15 K is due to the freeze-out processes that greatly reduce the gas-phase abundances of key species such as CO, thus, the chemical reactions we described in Sec. 2 are no longer satisfied.
) at t = 106 yr. The black horizontal line represents the fiducial value and the horizontal dotted lines represent 50% of the deviation from the input values. Orange, green, and blue dashed lines represent results at Tk = 15, 50, and 100 K. Columns from left to right represent simulations with the cloud densities nH = 104, 105, and 106 cm−3. The large deviation at 15 K is due to the freeze-out processes that greatly reduce the gas-phase abundances of key species such as CO, thus, the chemical reactions we described in Sec. 2 are no longer satisfied.
Current usage metrics show cumulative count of Article Views (full-text article views including HTML views, PDF and ePub downloads, according to the available data) and Abstracts Views on Vision4Press platform.
Data correspond to usage on the plateform after 2015. The current usage metrics is available 48-96 hours after online publication and is updated daily on week days.
Initial download of the metrics may take a while.