Open Access
Fig. A.1
Download original image
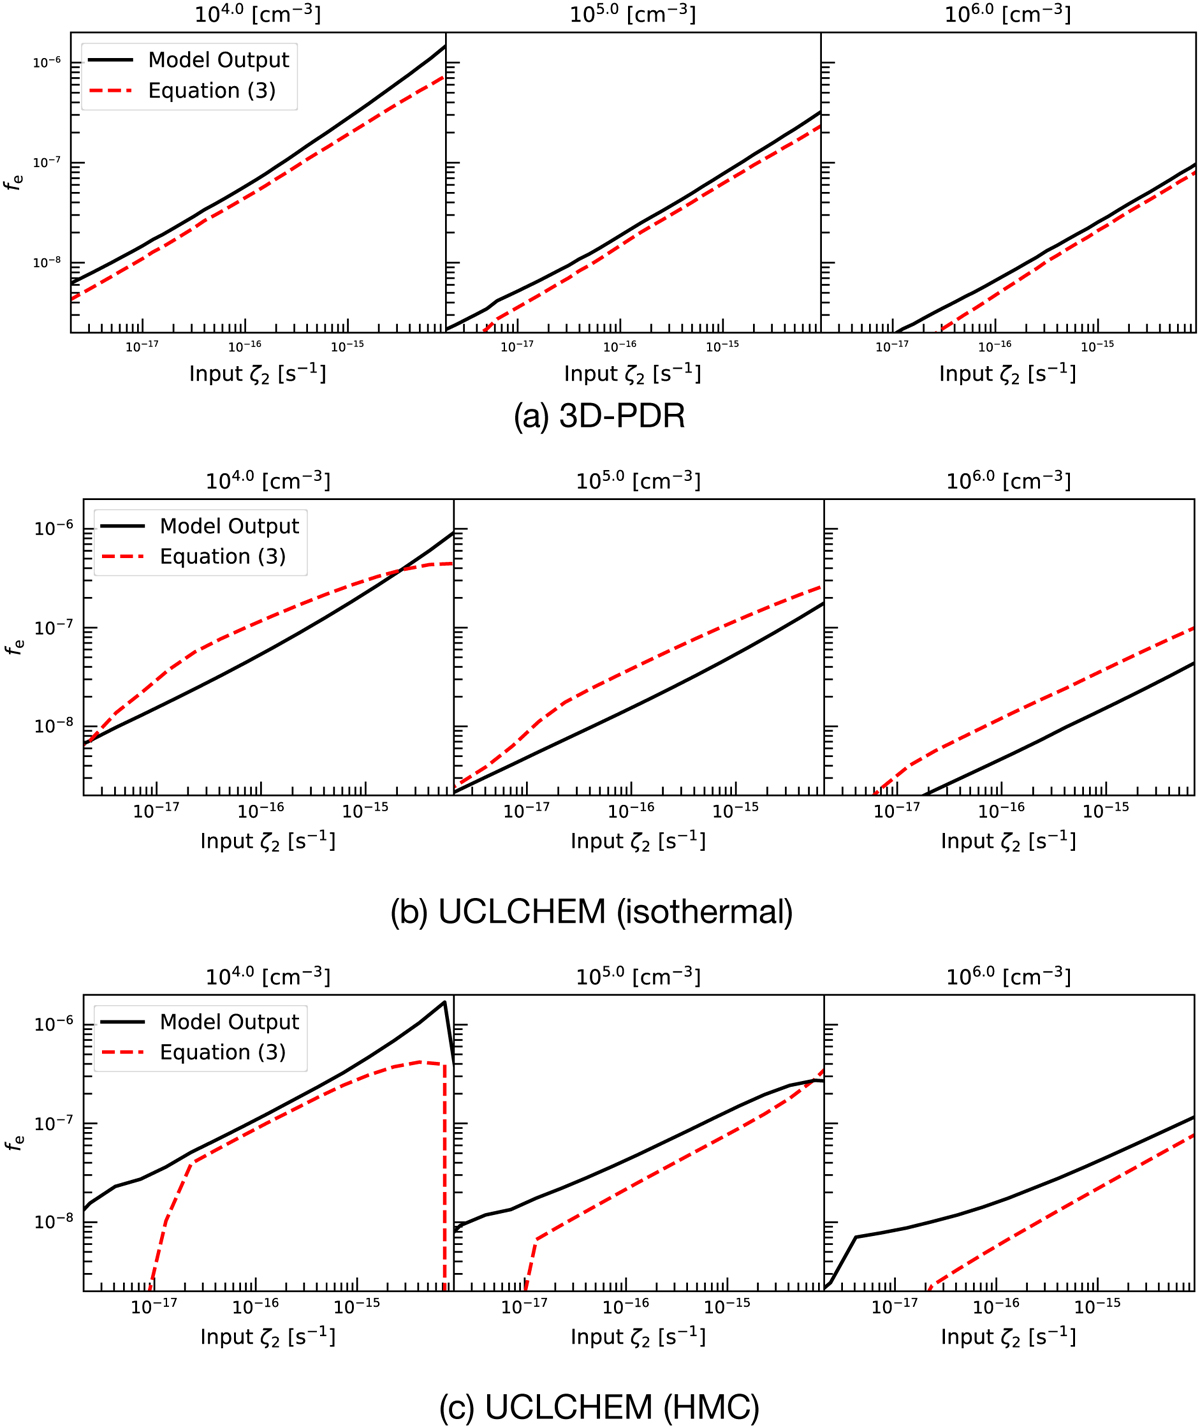
(a): Comparison of electron fraction as a function of ζ2 as obtained from the 3D-PDR output (black solid curves) and from Eq. 3 (red dashed curves). (b): The same as (a) while for the isothermal simulations from UCLCHEM. (c): The same as (a) while for the HMC simulations from UCLCHEM.
Current usage metrics show cumulative count of Article Views (full-text article views including HTML views, PDF and ePub downloads, according to the available data) and Abstracts Views on Vision4Press platform.
Data correspond to usage on the plateform after 2015. The current usage metrics is available 48-96 hours after online publication and is updated daily on week days.
Initial download of the metrics may take a while.