Fig. 10
Download original image
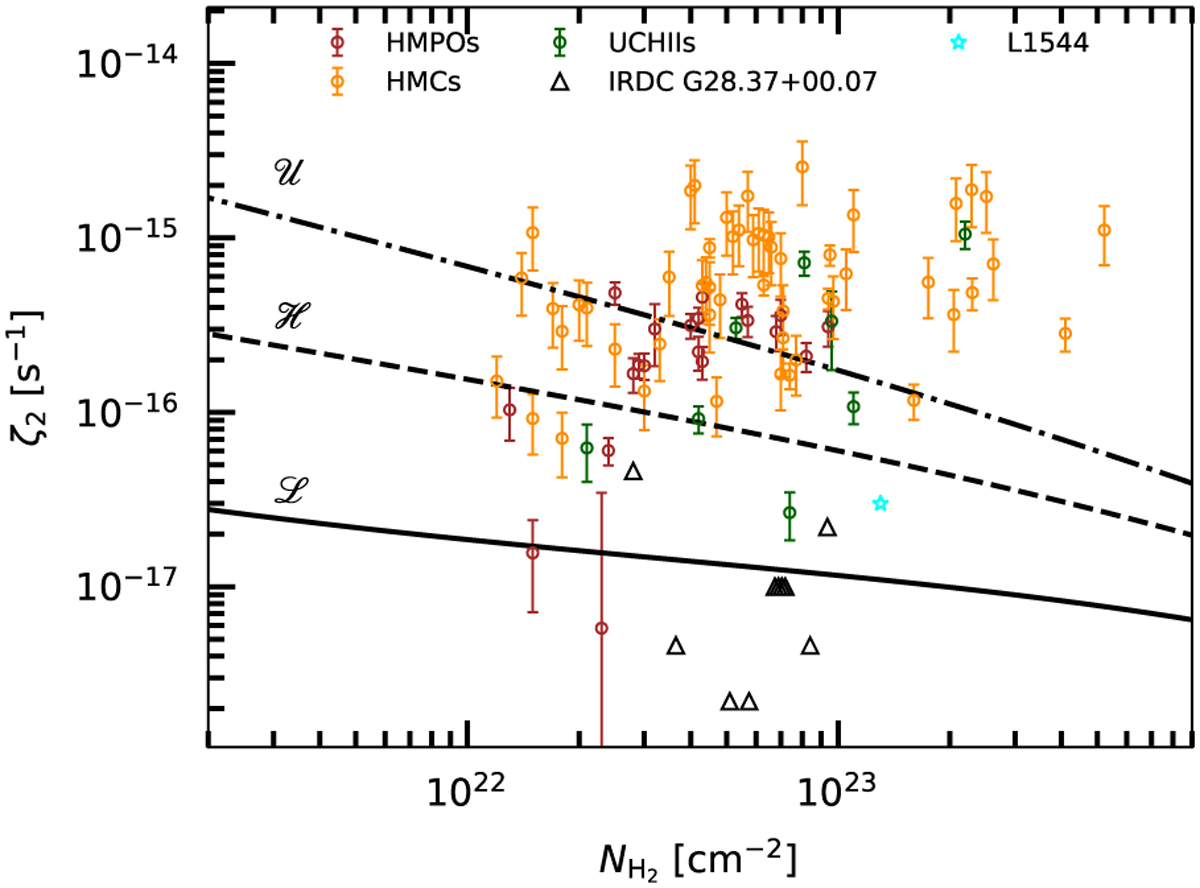
Calculated ζ2 toward HMPOs (brown), HMCs (orange), and UCH IIs (green). Black triangles represent CRIR from IRDC G28.37+00.07, which are taken from Entekhabi et al. (2022). The cyan star represents CRIR from prestellar core L1544, which is taken from Redaelli et al. (2021). The black solid, dashed, and dash-dotted curves denote the theoretical CR attenuation models ℒ, ℋ, and 𝒰 by Padovani et al. (2024).
Current usage metrics show cumulative count of Article Views (full-text article views including HTML views, PDF and ePub downloads, according to the available data) and Abstracts Views on Vision4Press platform.
Data correspond to usage on the plateform after 2015. The current usage metrics is available 48-96 hours after online publication and is updated daily on week days.
Initial download of the metrics may take a while.