Fig. 1
Download original image
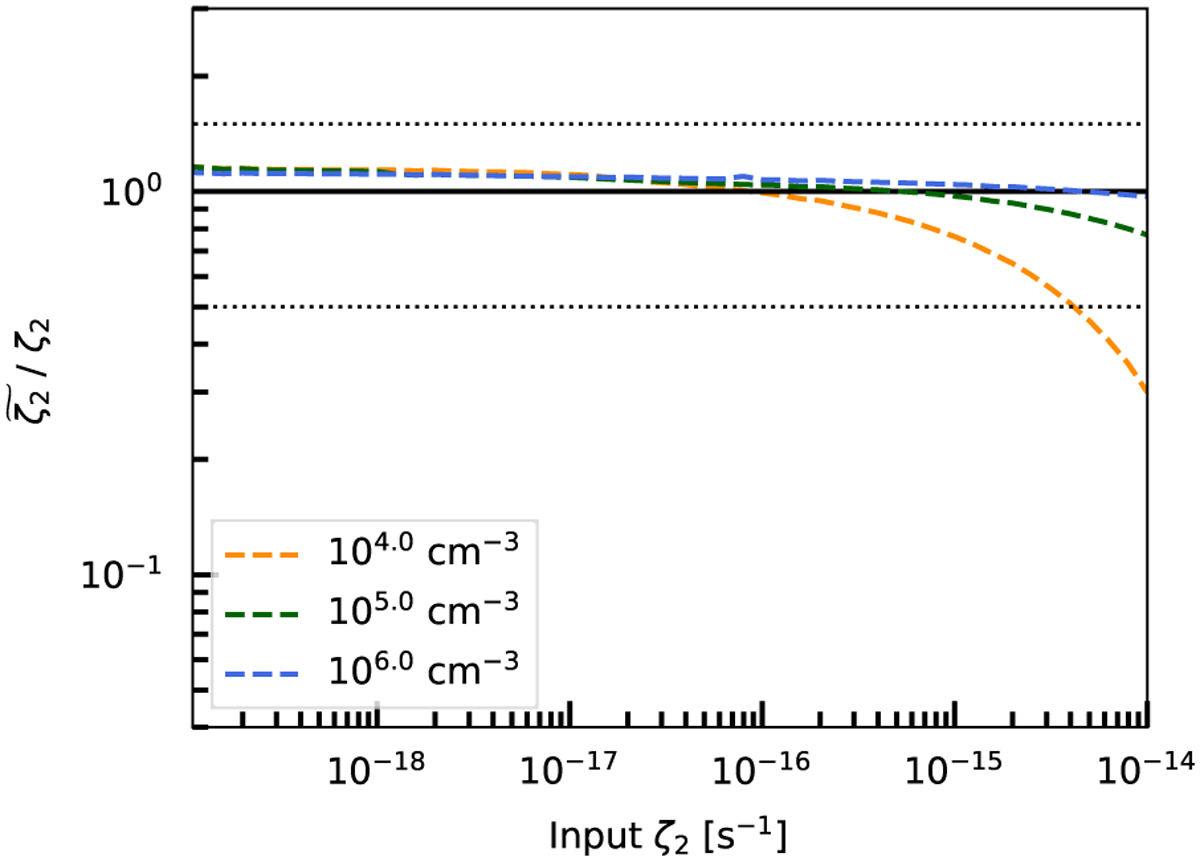
Comparison between our approach and 3D-PDR simulations. The x-axis denotes the input CRIR of each simulation, where the CRIR in each simulation is treated as uniform. The y-axis denotes the ratio between the calculated CRIR and the input one ![]() at Av = 20 mag. The black horizontal line represents the fiducial value and the horizontal dotted lines represent 50% of the deviation from the input values. Orange, green, and blue dashed lines represent results at nH = 104, 105, and 106 cm−3. The external FUV intensity for all simulations is normalized to the Draine unit (χ/χ0 = 1).
at Av = 20 mag. The black horizontal line represents the fiducial value and the horizontal dotted lines represent 50% of the deviation from the input values. Orange, green, and blue dashed lines represent results at nH = 104, 105, and 106 cm−3. The external FUV intensity for all simulations is normalized to the Draine unit (χ/χ0 = 1).
Current usage metrics show cumulative count of Article Views (full-text article views including HTML views, PDF and ePub downloads, according to the available data) and Abstracts Views on Vision4Press platform.
Data correspond to usage on the plateform after 2015. The current usage metrics is available 48-96 hours after online publication and is updated daily on week days.
Initial download of the metrics may take a while.