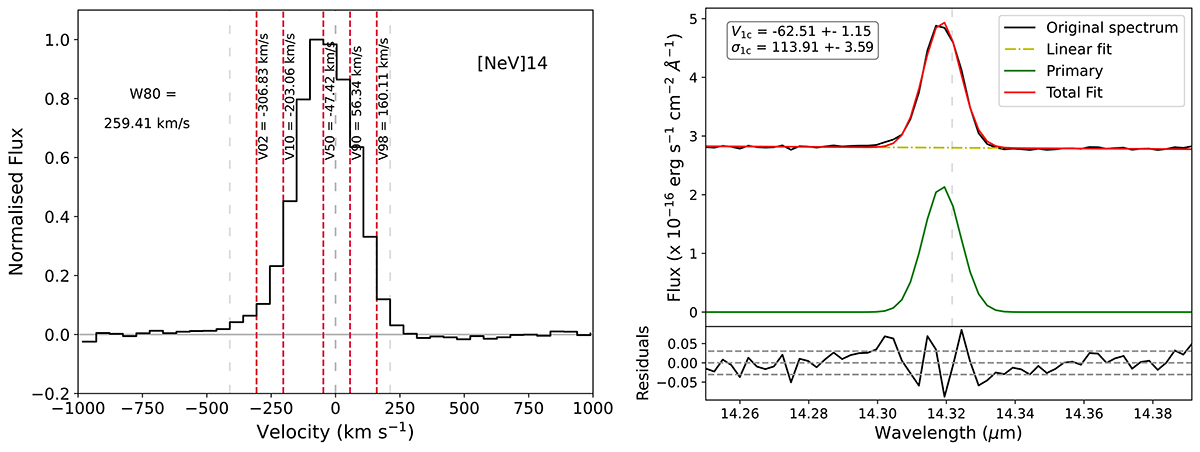
Fig. B.2.
Download original image
Examples on the modelling of the [Ne V]14 line with the non-parametric (left) and the parametric techniques (right). Left panel: Normalised flux of the line integrated in the nuclear region (R = 0.5″) with respect to the velocity. Grey, dashed, vertical lines indicate the limits of the line for doing the non-parametric modelling (see text in Appendix A). Red, dashed, vertical lines indicate the different parameters described in Sect. 2. Right panel: Gaussian modelling of the integrated nuclear region. The yellow line is the linear fit to the continuum, the green curve indicates the primary component, and the red curve indicates the global fit. The grey, dashed, horizontal lines in the residuals indicate the 3ε limits (see Sect. 2). The σ is corrected from the instrumental value (see Sect. 2). In both panels the central, grey, dashed, vertical line indicates the expected position of the line in rest frame, corrected from the systemic value with a redshift of 0.00868.
Current usage metrics show cumulative count of Article Views (full-text article views including HTML views, PDF and ePub downloads, according to the available data) and Abstracts Views on Vision4Press platform.
Data correspond to usage on the plateform after 2015. The current usage metrics is available 48-96 hours after online publication and is updated daily on week days.
Initial download of the metrics may take a while.