Fig. 5.
Download original image
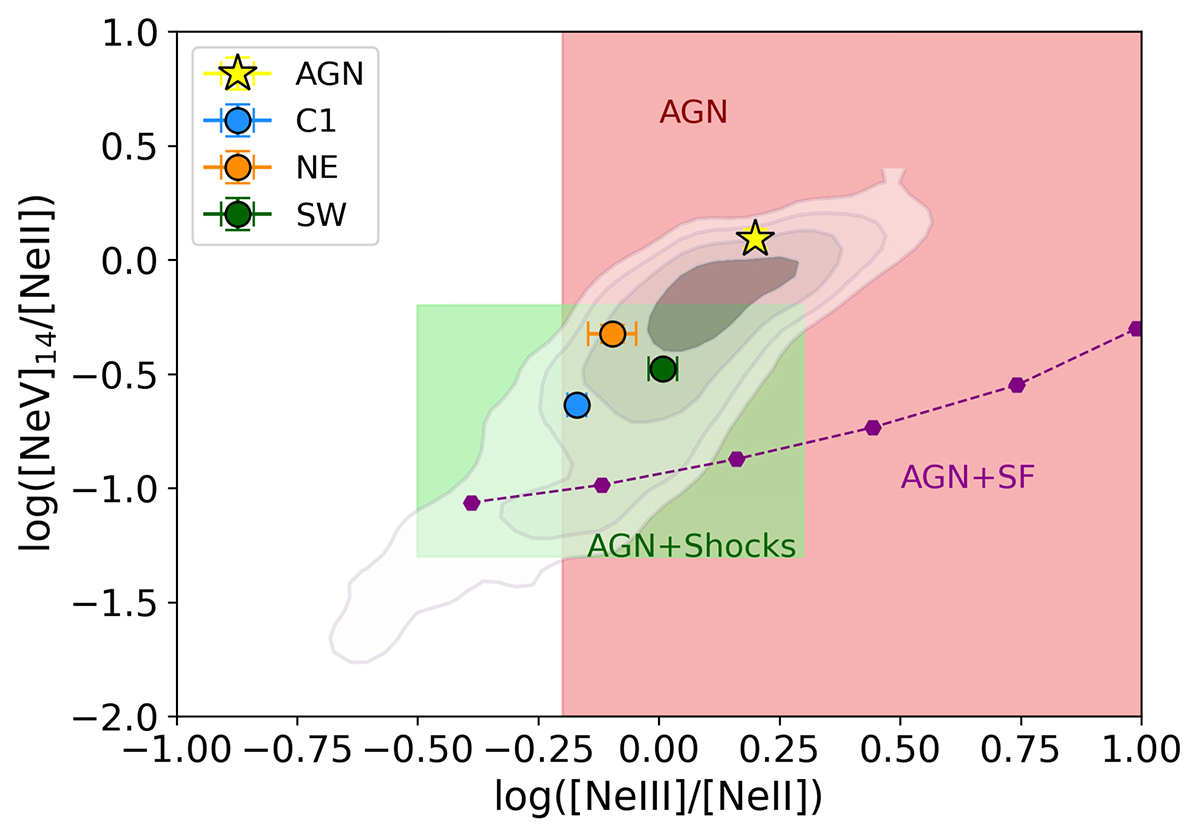
Mid-infrared line ratios following Fig. 5 in Feltre et al. (2023). We represent the spatially resolved line ratios for NGC 7172 as white and grey contours (levels from 1 to 10 spaxels). The yellow star represents the ratio estimated in the integrated spectrum for the nuclear region (AGN). The orange and green circles are the NE and SW regions in the cone. The blue circle represents the star-forming clump C1. The green region (i.e. square) represents AGN+shock models with velocities varying from 200 to 1000 km s−1, the red region represents AGN models at ≥1/3 solar metallicity, and the purple hexagons and line represents AGN+SF models with the ionisation parameter increasing from left to right (for more details, see Fig. 5 of Feltre et al. 2023).
Current usage metrics show cumulative count of Article Views (full-text article views including HTML views, PDF and ePub downloads, according to the available data) and Abstracts Views on Vision4Press platform.
Data correspond to usage on the plateform after 2015. The current usage metrics is available 48-96 hours after online publication and is updated daily on week days.
Initial download of the metrics may take a while.