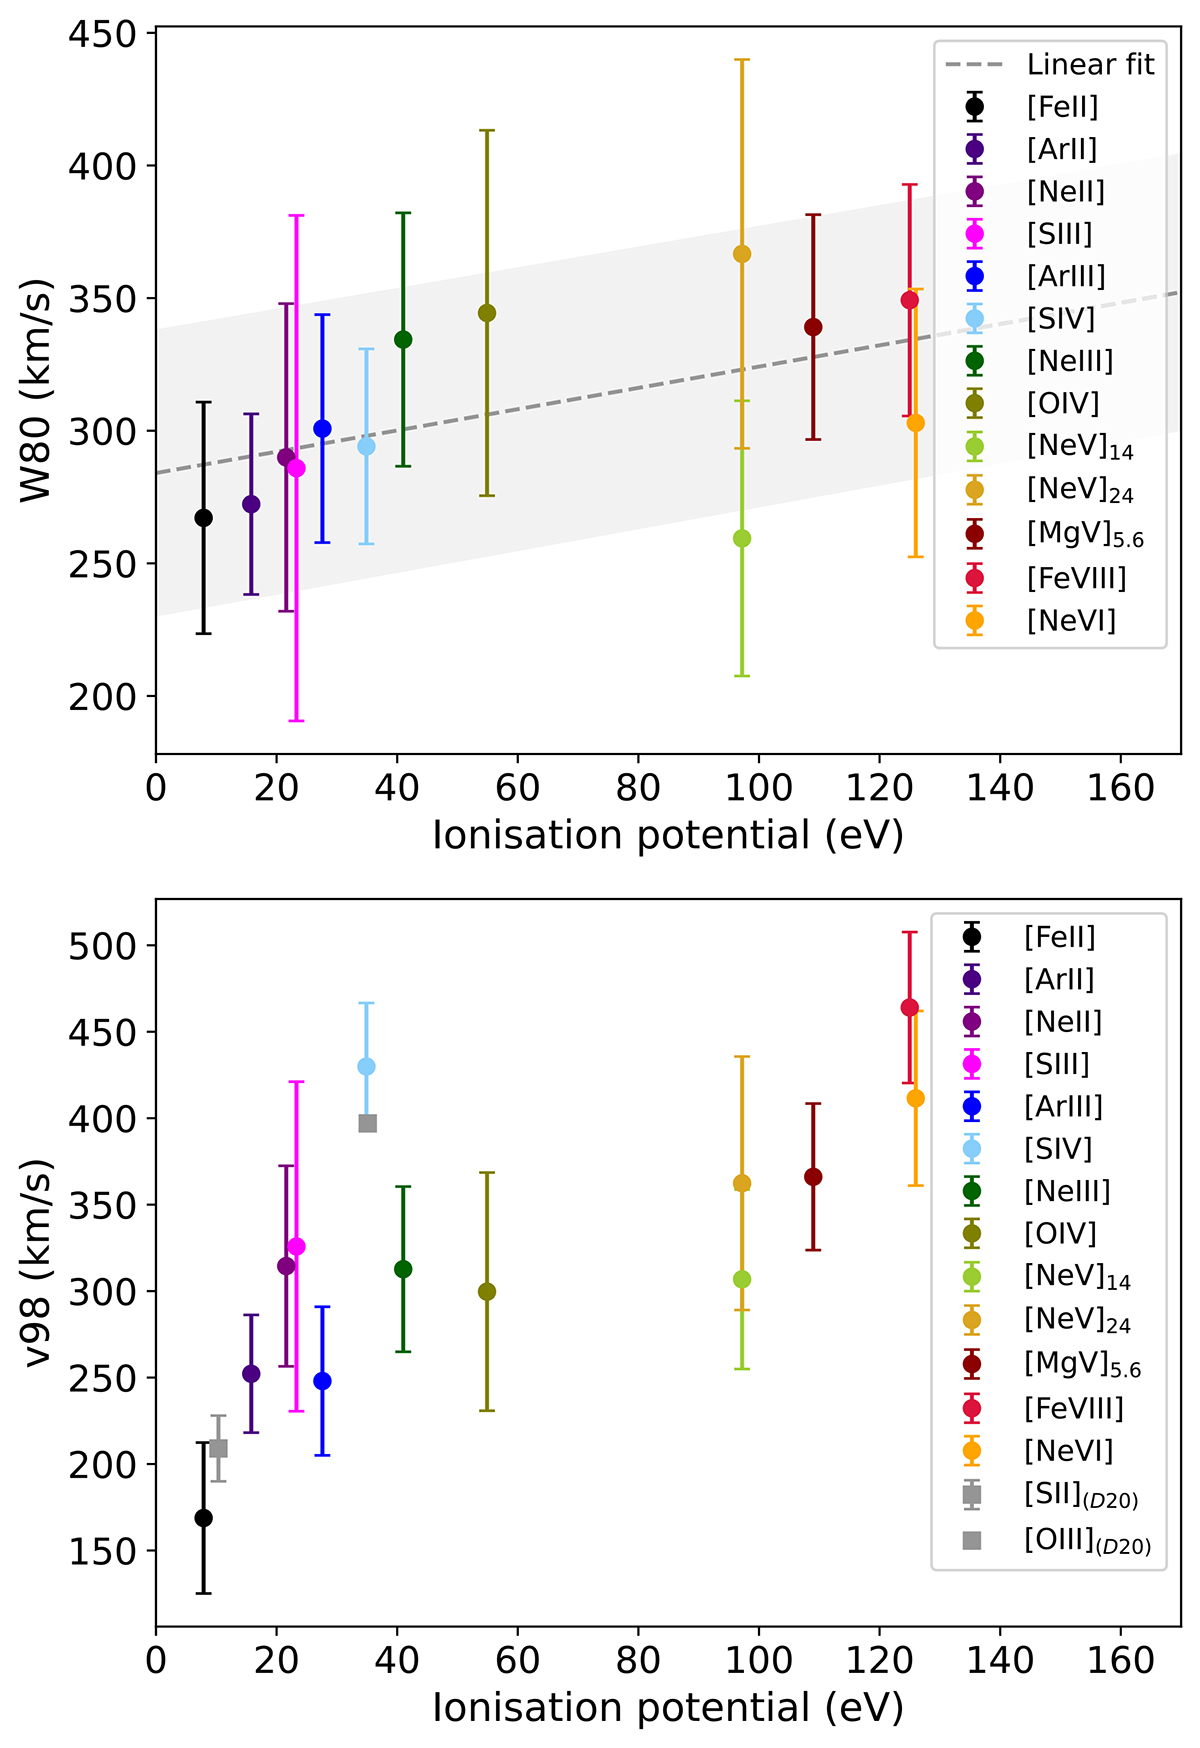
Fig. 3.
Download original image
W80 (top panel) and v98 (bottom panel) measured in the integrated nuclear spectrum (R ∼ 0.5″) with respect to the emission lines IP. The dashed grey line in the top panel corresponds to a linear fit of the points and the 1σ uncertainty. The grey squares in the bottom panel indicate the v98 value reported by Davies et al. (2020) for the optical [S II] and [O III] lines with their uncertainties. The error bars in our data are obtained accounting for the standard deviation of the continuum near the line and the spectral resolution.
Current usage metrics show cumulative count of Article Views (full-text article views including HTML views, PDF and ePub downloads, according to the available data) and Abstracts Views on Vision4Press platform.
Data correspond to usage on the plateform after 2015. The current usage metrics is available 48-96 hours after online publication and is updated daily on week days.
Initial download of the metrics may take a while.