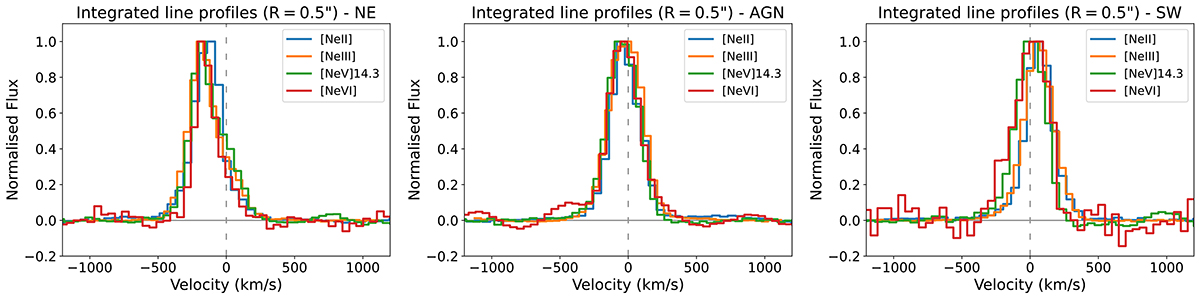
Fig. 2.
Download original image
Emission line profiles of the ionised gas obtained from an integrated spectrum (circular aperture with R ∼ 0.5″) in the nuclear region (middle), NE (left), and SW (right) parts of the cone (see Fig. 1). All the velocities refer to the systemic value computed with z = 0.00868 (see Sect. 1) indicated by the dashed, vertical grey lines. Fluxes were normalised to the maximum of each line.
Current usage metrics show cumulative count of Article Views (full-text article views including HTML views, PDF and ePub downloads, according to the available data) and Abstracts Views on Vision4Press platform.
Data correspond to usage on the plateform after 2015. The current usage metrics is available 48-96 hours after online publication and is updated daily on week days.
Initial download of the metrics may take a while.