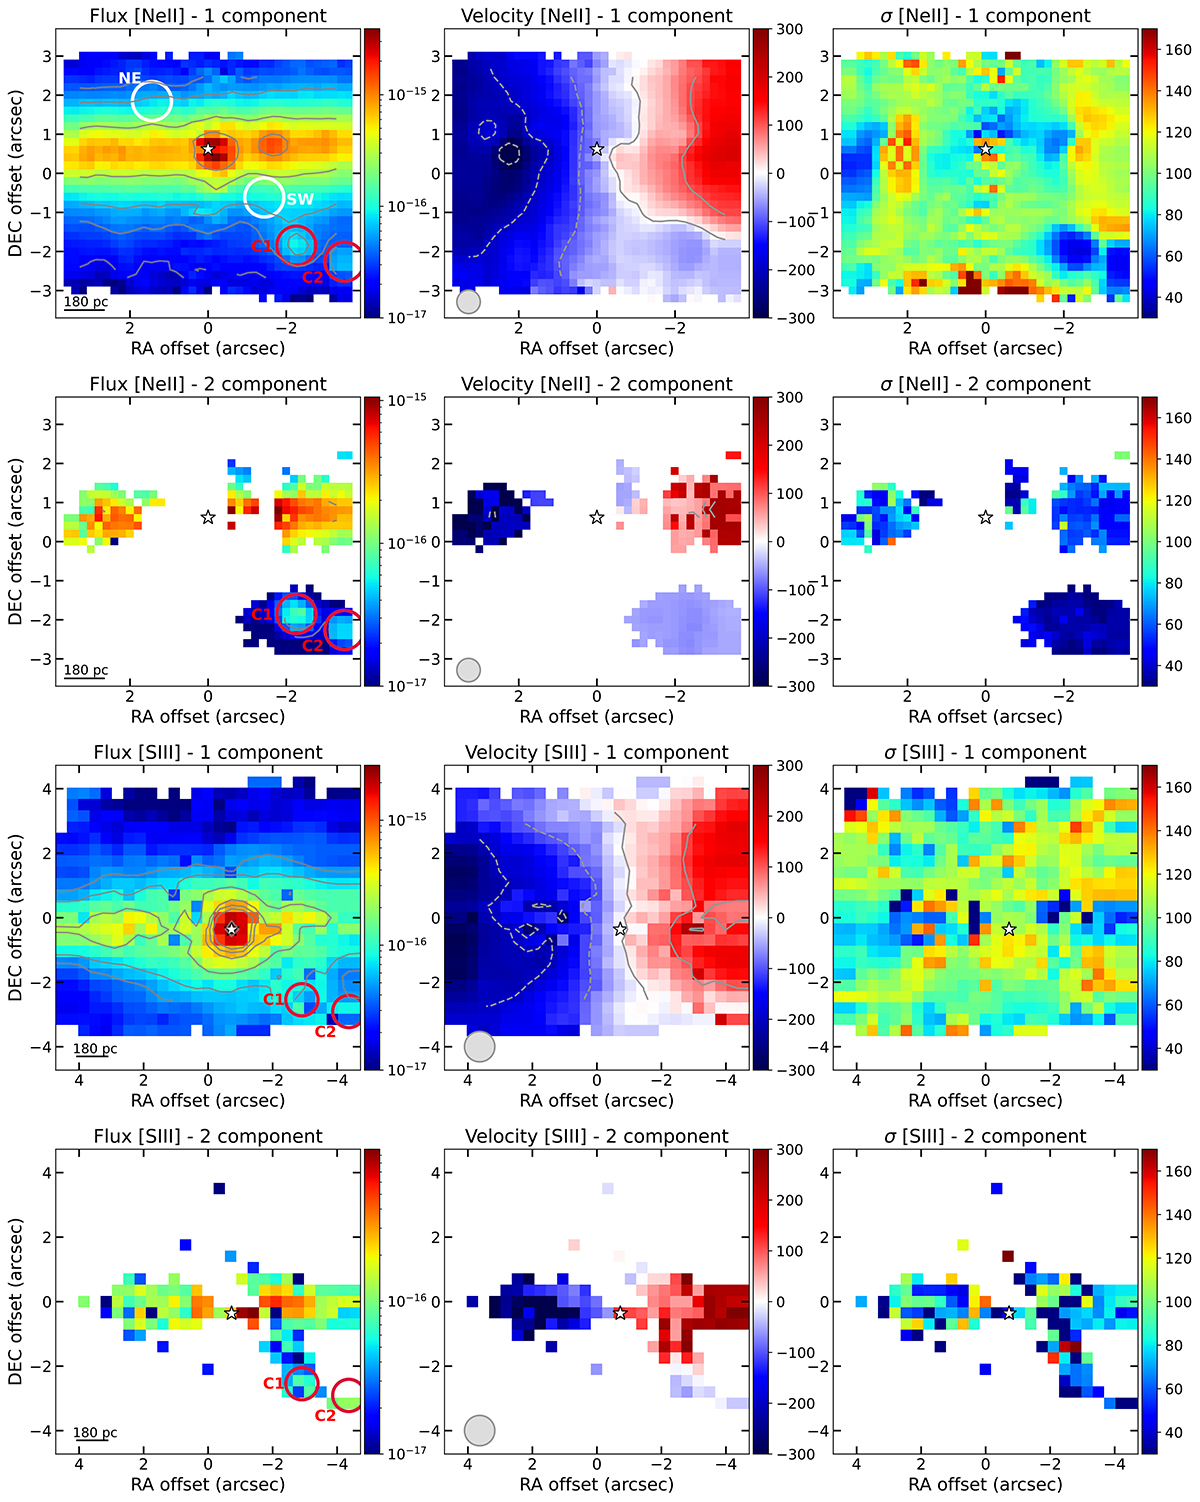
Fig. B.5.
Download original image
Maps of the two components model fit to the emission lines, following the description of Fig. 1. From left to right we show the flux maps in erg s−1 cm−2, the velocity, and the velocity dispersion in km s−1. The photometric centre measured in the continuum of each channel is marked with a white star, the grey circle in the middle panels is the PSF, and the black line in the left panels is a 1″ physical scale.
Current usage metrics show cumulative count of Article Views (full-text article views including HTML views, PDF and ePub downloads, according to the available data) and Abstracts Views on Vision4Press platform.
Data correspond to usage on the plateform after 2015. The current usage metrics is available 48-96 hours after online publication and is updated daily on week days.
Initial download of the metrics may take a while.