Fig. 3.

Download original image
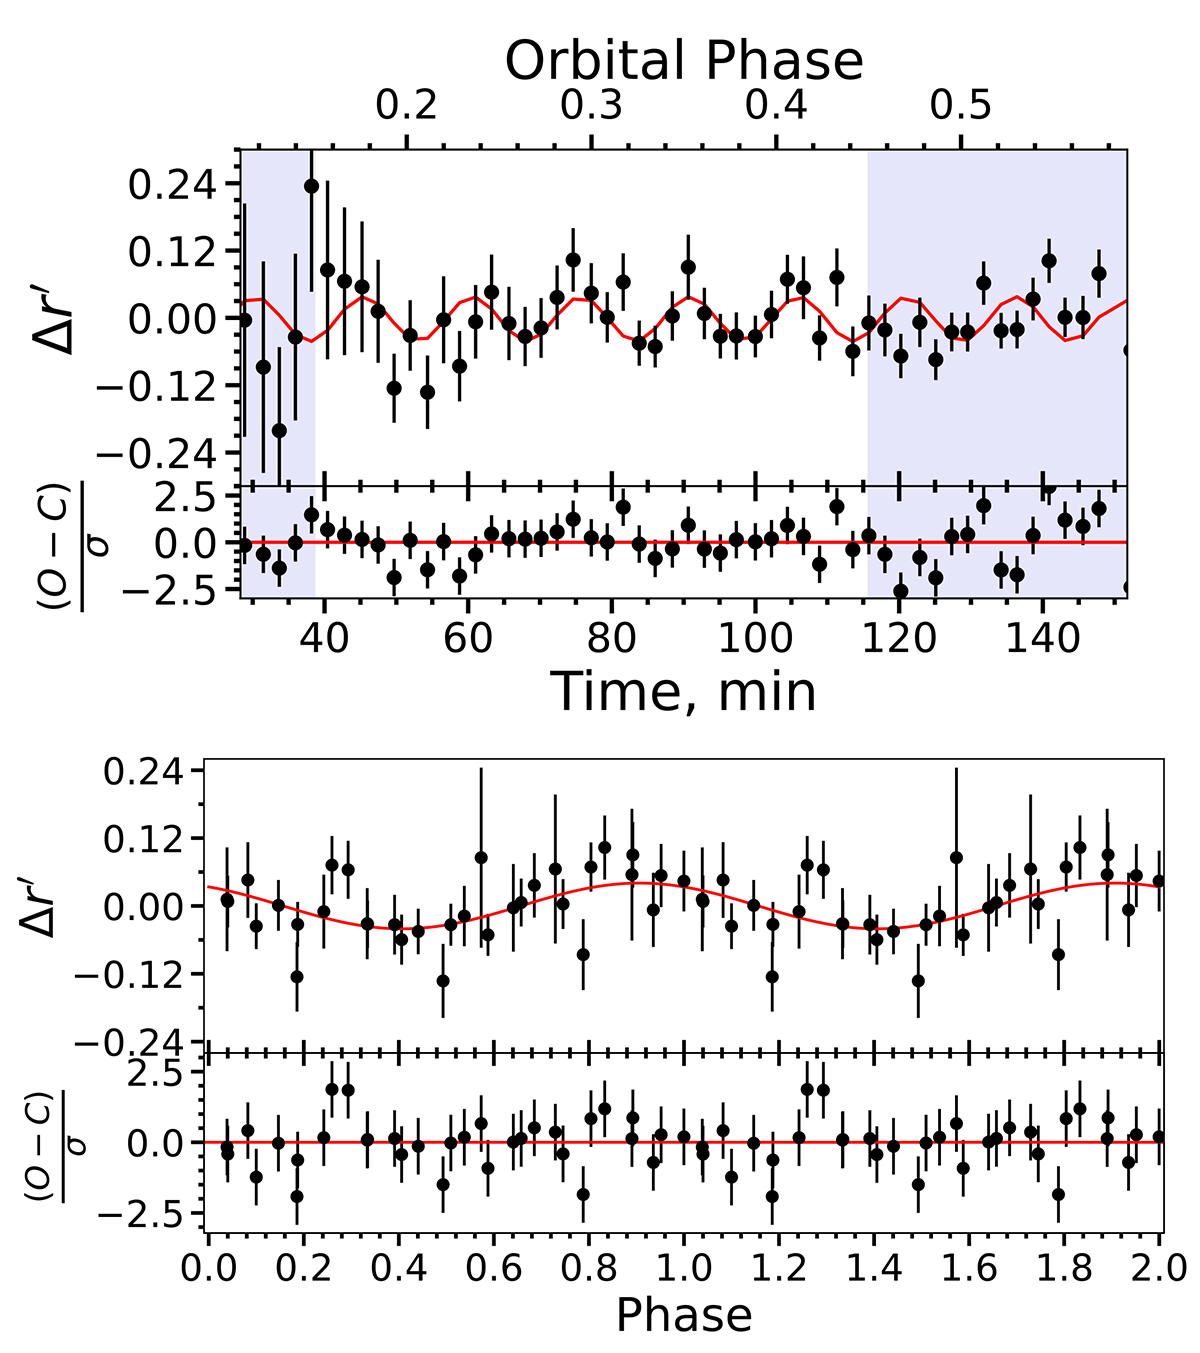
Result of the small-scale brightness variations analysis. Top panel: J1513 filtered light curve in the r′ band (black points with error bars). Points within shaded areas are excluded from the periodicity search. The red line is the best fit of the data by a sine function with the period of 15.3 min found from the periodicity search. The sub-panel shows fit residuals. Middle panel: power spectrum of the filtered light curve (the solid line) with its uncertainties (vertical error bars). The largest peak corresponds to the 15.3 min period. Bottom panel: light curve folded with this period and fitted with the sine function of the same period. The sub-panel shows fit residuals.
Current usage metrics show cumulative count of Article Views (full-text article views including HTML views, PDF and ePub downloads, according to the available data) and Abstracts Views on Vision4Press platform.
Data correspond to usage on the plateform after 2015. The current usage metrics is available 48-96 hours after online publication and is updated daily on week days.
Initial download of the metrics may take a while.


