Fig. 2.

Download original image
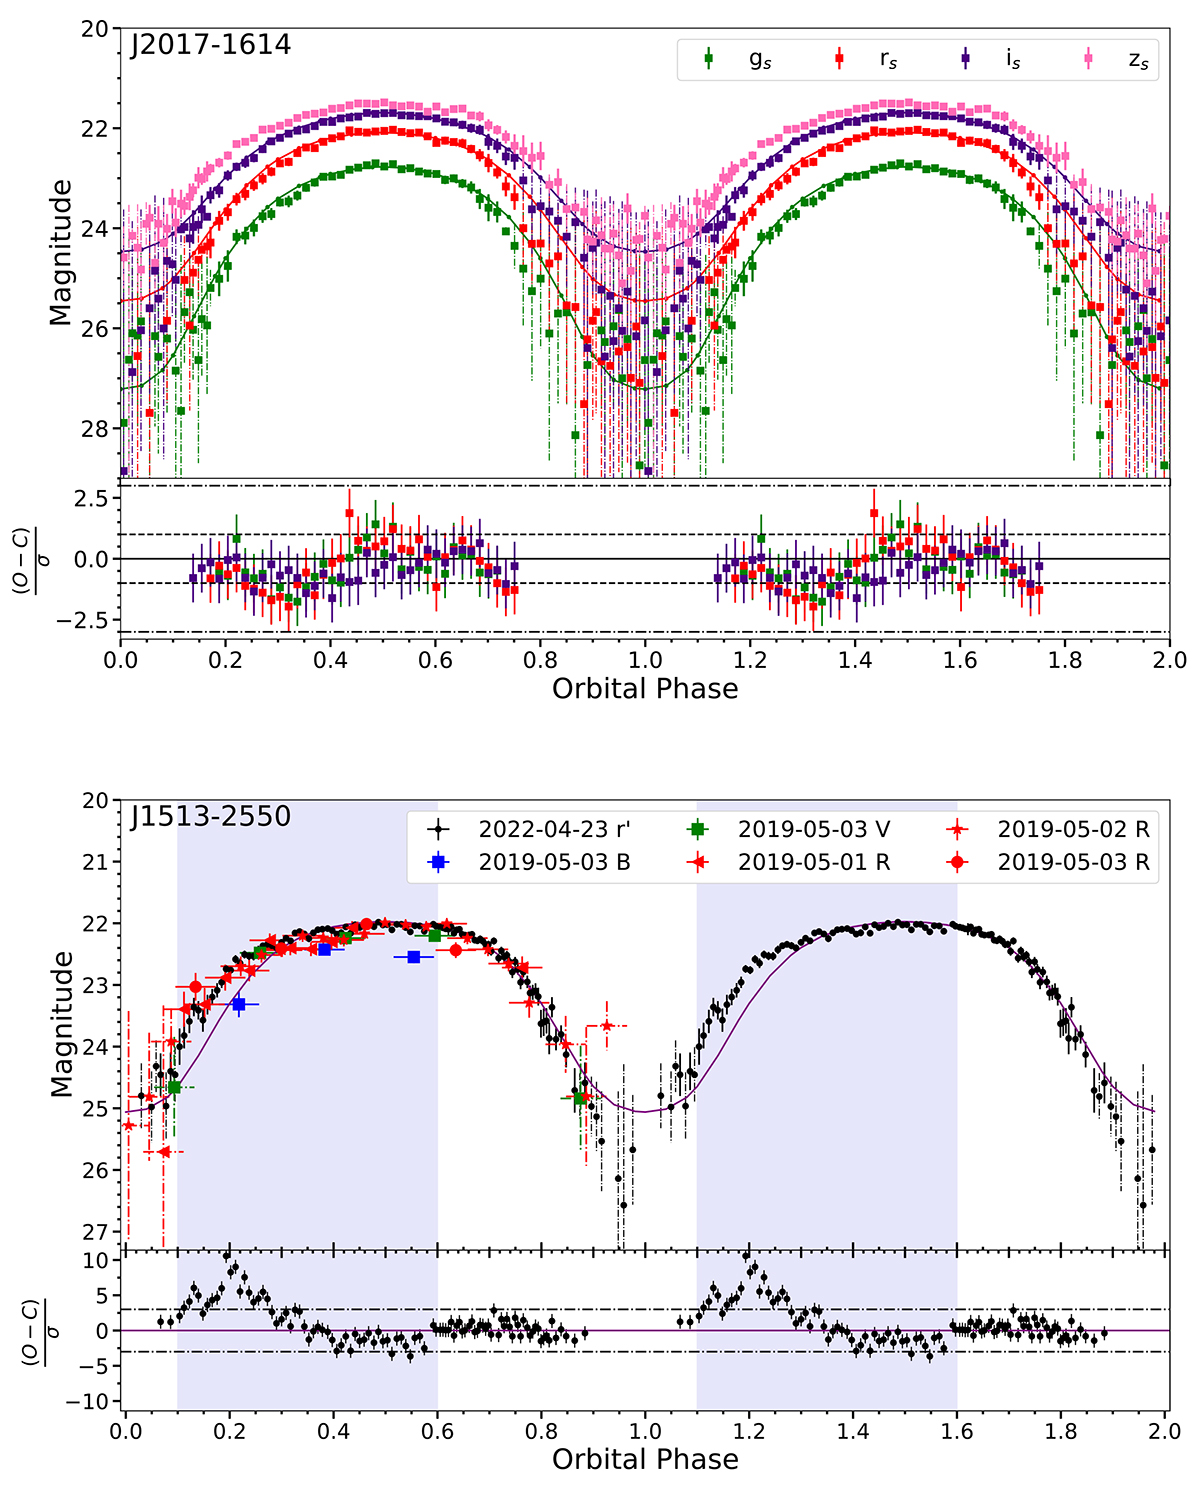
Light curves of the two pulsars and results of their modelling. Top panel: gs, rs, is, and zs band light curves of the J2017 system folded with the orbital period and the best-fitting model (solid lines). Two periods are shown for clarity. Bottom panel: J1513 light curves folded with the orbital period. Data obtained in different filters and different nights are shown with various colours and symbols, indicated in the legend. All magnitudes are in the AB system. The best-fitting model is shown by the solid line. Shaded areas mark the part of the light curves where small-scale wavering was detected (see text for details). In both panels, points with dashed error bars lie below the 3σ detection limits. The phases ϕ = 0.0 correspond to the minima of the systems’ model brightness. Sub-panels show residuals calculated as the difference between the observed (O) and calculated (C) magnitudes for each data point in terms of the magnitude error, σ.
Current usage metrics show cumulative count of Article Views (full-text article views including HTML views, PDF and ePub downloads, according to the available data) and Abstracts Views on Vision4Press platform.
Data correspond to usage on the plateform after 2015. The current usage metrics is available 48-96 hours after online publication and is updated daily on week days.
Initial download of the metrics may take a while.


