Fig. 2.
Download original image
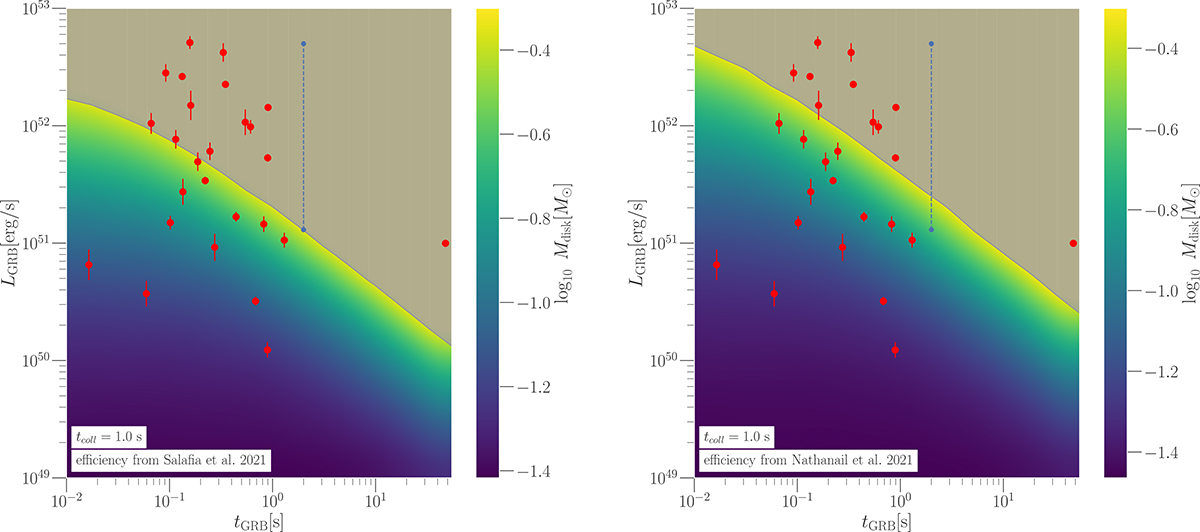
Disk mass required, according to our model, for the production of a short gamma-ray burst. The background color represents the mass of the disk in both cases, calculated as the mean value of our posteriors. The red points represent observational events (see the main text for details). The vertical dashed blue line corresponds to the core luminosity of GRB170817A. The shaded region indicates where the disk mass exceeds 0.3 M⊙, which is an approximate limit derived from numerical relativity simulations. The solid gray line marks the boundary between these two regions. In the left panel, we used the efficiency profile from Salafia & Giacomazzo (2021), and in the right panel, we adopted the corresponding efficiency for a jet profile from Nathanail et al. (2021).
Current usage metrics show cumulative count of Article Views (full-text article views including HTML views, PDF and ePub downloads, according to the available data) and Abstracts Views on Vision4Press platform.
Data correspond to usage on the plateform after 2015. The current usage metrics is available 48-96 hours after online publication and is updated daily on week days.
Initial download of the metrics may take a while.