Fig. 9.
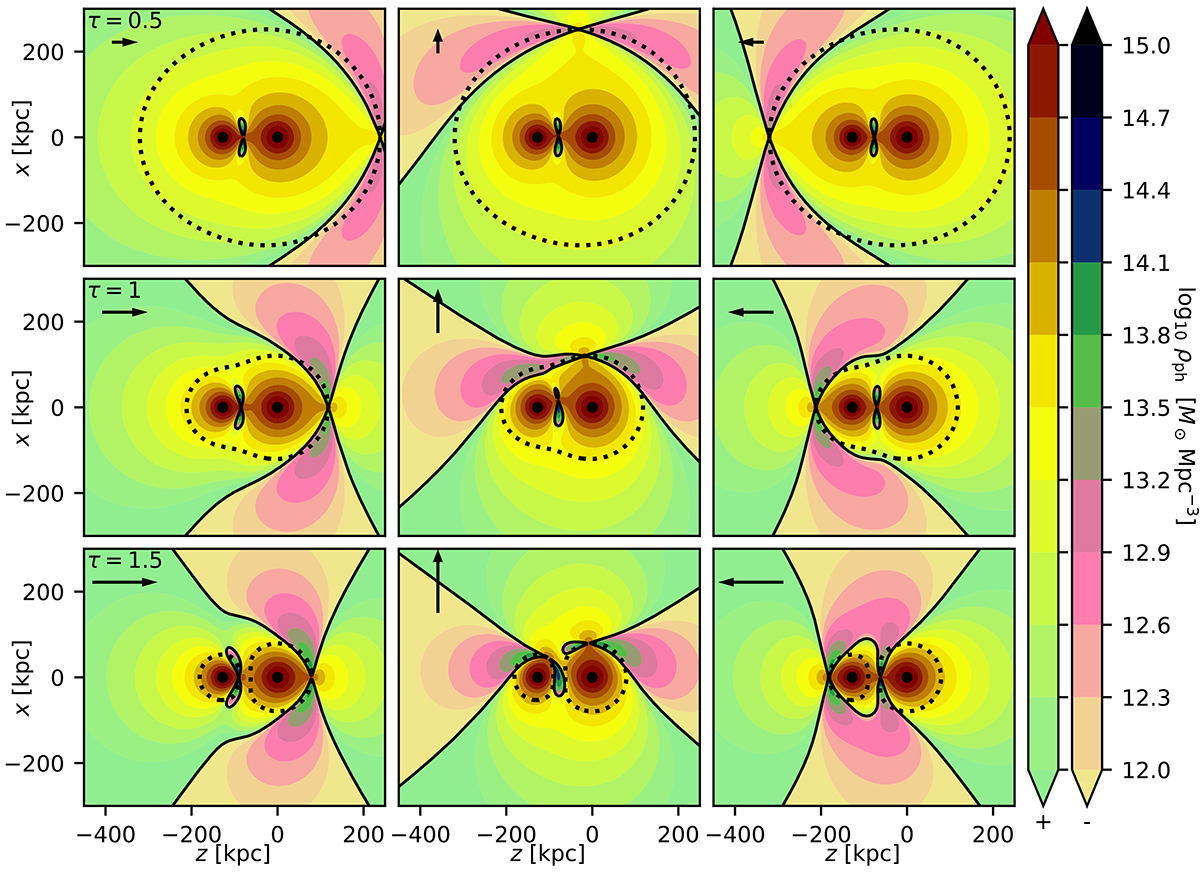
Download original image
Pair of point masses in an external field. The image shows the density of the PDM in a plane going through the point masses. Different columns correspond to different directions of the external field. The direction is indicated by the arrows. In each column, the magnitude of the external field is stronger with each tile downwards. The magnitude is specified through the τ parameter defined by Eq. (35). The dashed curves indicate the surfaces within which we neglected the EFE in Sect. 7.2. The full black lines indicate the boundaries between the regions of positive and negative density of the PDM.
Current usage metrics show cumulative count of Article Views (full-text article views including HTML views, PDF and ePub downloads, according to the available data) and Abstracts Views on Vision4Press platform.
Data correspond to usage on the plateform after 2015. The current usage metrics is available 48-96 hours after online publication and is updated daily on week days.
Initial download of the metrics may take a while.